Part 3 - Add Uptime Kuma restoration and join it all into one workflow
Go to previous section Download Markdown
December 17, 2025
Table of Contents
-
6. Create an Uptime Kuma restoration job [Template 3]
- Pre-requisites for the Galera Monitor service in Uptime Kuma
- Create a service account in GCP & add it as a custom credential type
- Uptimekuma restoration template + Push scripts to monitor Galera cluster
- Play 1: The "Staging" Phase (Localhost)
- Play 2a: Kuma Restoration Phase (Remote VPS)
- Play 2b. The Self-Monitoring Setup (The Push Monitor)
- Play 2c: Set up jail and log monitoring
- Play 2d: The High Availability monitoring script
- Play 3: Clean up on AWX
- Create a third job template in AWX
- Troubleshooting the 3rd template
- 7. Create a Workflow Template to join the 3 jobs
6. Create an Uptime Kuma restoration job [Template 3]
In this workflow, we are automating the final piece of a Galera Cluster deployment. We have already provisioned a VPS (Hetzner) and configured VPN networking with garb Arbitrator service. Now, we need to deploy Uptime Kuma to this node to act as a local monitor.
💡 Note
Crucially, we are not starting from scratch. We are restoring a backup from Google Cloud Storage (GCS) so our monitoring history and settings are preserved, and we are configuring the node to monitor itself immediately upon boot. In other words, you will need a pre-prepared
kuma.dbSQLite file that can be fetched.
Pre-requisites for the Galera Monitor service in Uptime Kuma
- In order to observe the status of the cluster (e.g. how many nodes are active), we will need to have set up a system user with limited privileges in order to reach one DB in the cluster (pick the most stable one).
- You will therefore need to set it up only on one node, but it is recommended to apply it on all or a template that you use to ensure you can reach them in the future.
- SSH into any of the Galera nodes (since they sync users and their credentials between each other) and run these commands - use the IP range that you use for your S2S VPN, as that is the incoming IP that the cluster will see:
mysql -u root -p

-- Create a user that can connect from the VPN subnet (10.10.10.x)
CREATE USER 'kuma_monitor'@'10.10.10.%' IDENTIFIED BY 'YOUR_SECURE_PASSWORD';

-- Grant minimal access (USAGE is enough to check status)
GRANT USAGE ON *.* TO 'kuma_monitor'@'10.10.10.%';
FLUSH PRIVILEGES;- Also, if you run
ufwon the nodes (or a similar local firewall service likeiptables), ensure that the VPS can reach the node(s) for monitoring of the cluster size. It is best to monitor one node from each site or all of them, if you prefer.
# Allow SQL connections from the WireGuard VPN subnet
sudo ufw allow from 10.10.10.0/24 to any port 3306 proto tcp- Add the credentials for the
kuma_monitorinto AWX. Go to Administration -> Credential Types and click Add. - Name:
Galera Monitor User - Add the input configuration & injector configuration below:
# Input configuration:
---
fields:
  - id: username
    type: string
    label: Database Username
  - id: password
    type: string
    label: Database Password
    secret: true

# Injector configuration:
---
extra_vars:
  db_monitor_user: '{{ username }}'
db_monitor_pass: '{{ password }}'-
Then to save content of the credentials, go to Resources -> Credentials and click on the Add button.
- Name:
Witness DB Monitor - Credential Type: Select Galera Monitor User (the one you just created).
- Username:
kuma_monitor - Password: (Enter your secure password)
- Name:
-
Lastly, ensure that on both your Site 1 and Site 2 firewall, the port 3306 is opened on the site tunnel VPN interface. For example, in my case, on OPNSense, go to Firewall → Rules → choose the WireGuard S2S VPN interface and click on the + sign to add a new rule:
- Action:
Pass - Interface:
WG_S2S VPN - Direction:
in - Interface:
IPv4 - Protocol:
TCP - Source:
10.10.10.3/32(the IP of the tunnel on the VPS side) - Destination:
LAN net - Destination port:
3306to3306 - Log packets:
tick - Description:
Allow SQL kuma_monitor in
- Action:

Create a service account in GCP & add it as a custom credential type
- To reach your bucket with a backup of an Uptimekuma database to restore, you would need a service account from GCP. These steps show how to do it, although you may already have one set up from before:
- Navigate to GCP: Go to the GCP Console -> APIs and service -> Credentials.
- Click + Create credentials and select Service account from the drop-down menu
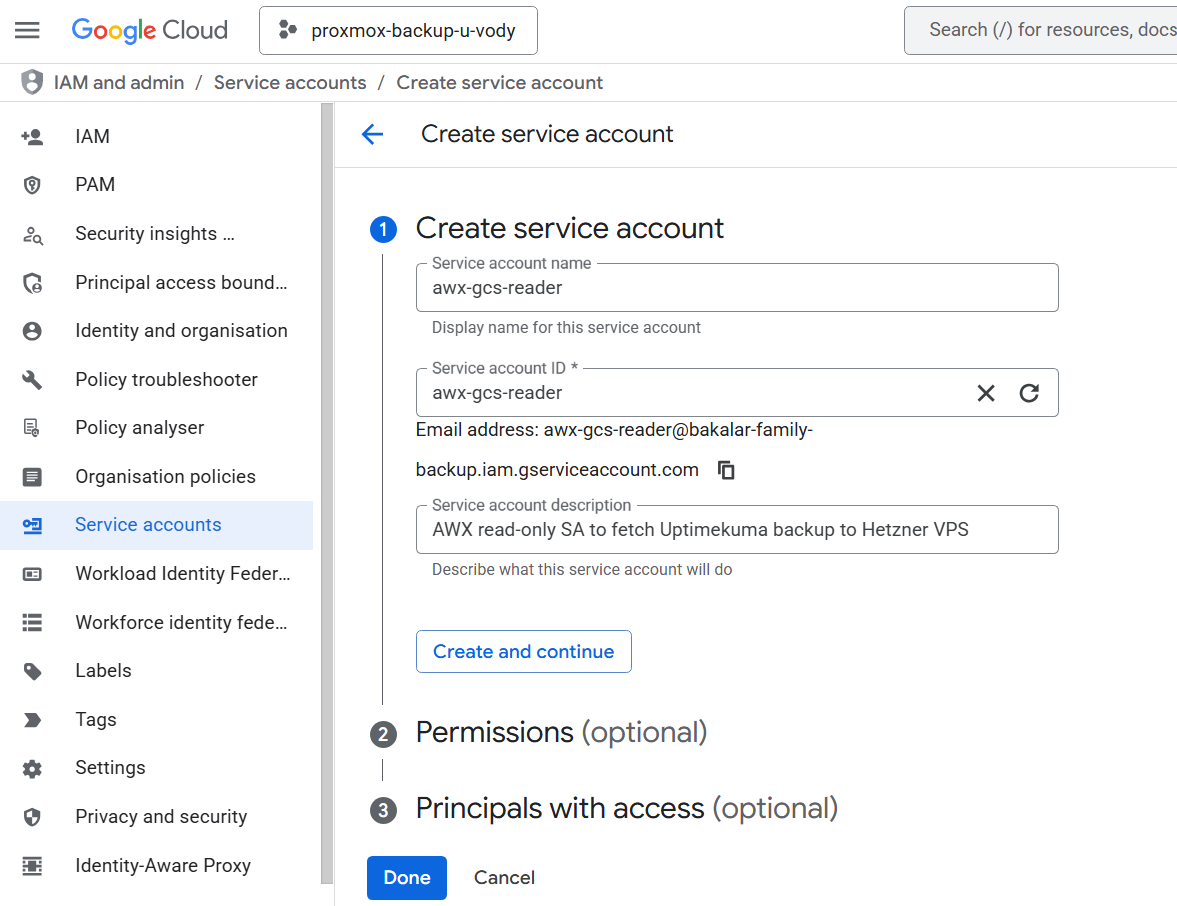
- Name:
awx-gcs-reader(or similar). - Service account ID: It will auto-populate.
- Click on the Create and Continue button.
- Name:
-
Grant Roles:
- Refresh the Credentials page to display your new service account. Open it and click on the Permissions tab. Then click on the Manage access button.
- Add role:
Storage Object ViewerandStorage Bucket Viewer (beta), which is needed for metadata. - This role provides read-only access to GCS objects, which is all we need.
- Click on the Save button.
-
Generate a JSON Key:
- Find your new
awx-gcs-readeraccount in the list of Credentials and click on it. - Go to the Keys tab.
- Click on Add key -> Create new key.
- Select JSON as the key type and click Create.
- Your browser will download a JSON file. Keep this file secure; you'll need its contents soon.
- Find your new
-
Next, we teach AWX how to understand this new GCP JSON key. Navigate to AWX: Go to Administration -> Credential Types and click on the Add button.
- Name:
GCP Service Account - Copy paste the content from the Input Configuration & Injector configuration fields.
- Name:
# Input configuration:
fields:
  - id: service_account_json
    type: string
    label: Service Account JSON
    secret: true

# Injector configuration
env:
GCP_SERVICE_ACCOUNT_CONTENTS: '{{ service_account_json }}'- Now we can save the credential. Navigate to AWX: Go to Resources -> Credentials and click on the Add button.
- Name:
GCP UptimeKuma Backup - Credential Type: Select your new
GCP Service Accountfrom the list. - Service Account JSON: Open the JSON file you downloaded from GCP before. Copy the entire contents and paste them into this field. Click on the Save button.
- Name:
Uptimekuma restoration template + Push scripts to monitor Galera cluster
Here is how this Ansible playbook (3-restore-uptimekuma.yml) works, step-by-step.
# 3-restore-uptimekuma.yml

---

- name: 1. Download Backup from GCS (on AWX)
  hosts: localhost
  connection: local
  gather_facts: no
  become: false

  vars:
    gcs_bucket: proxmox-backup-bachelor
    gcs_object_path: "hetzner-backup/kuma.db"
    local_temp_backup: "/tmp/kuma.db"
    gcs_project_id: "113447253568"

  tasks:
    - name: Download Uptime Kuma backup from GCS
      google.cloud.gcp_storage_object:
        action: download
        bucket: "{{ gcs_bucket }}"
        src: "{{ gcs_object_path }}"      # object name in the bucket
        dest: "{{ local_temp_backup }}"   # the local file path
        project: "{{ gcs_project_id }}"
        auth_kind: serviceaccount
        service_account_contents: "{{ lookup('env', 'GCP_SERVICE_ACCOUNT_CONTENTS') }}"
      register: gcs_download

    - name: Verify download
      ansible.builtin.debug:
        msg: "Successfully downloaded {{ gcs_object_path }} to {{ local_temp_backup }}"
      when: gcs_download.changed

- name: 2. Restore and Run Uptime Kuma (on Galera Witness VPS)
  hosts: galera-witness-hetzner
  become: true # Run tasks below as root

  vars:
    kuma_data_dir: /opt/uptimekuma
    db_monitor_hosts: "192.168.8.71 192.168.6.73"
    local_temp_backup: "/tmp/kuma.db" # Path on the AWX controller
    garb_push_url: "{{ 'http://127.0.0.1:3001/api/push/YOUR_GARB_PUSH_TOKEN'
                    + '?status=up&msg=Garb%20service%20is%20up&ping=' }}"
    cluster_push_url: "{{ 'http://127.0.0.1:3001/api/push/YOUR_CLUSTER_PUSH_TOKEN'
                       + '?status=up&msg=ok&ping=' }}" # The status message will vary and we will modify it later

  tasks:
    - name: Install System Tools (rsyslog, mariadb-client)
      ansible.builtin.apt:
        pkg:
          - rsyslog
        state: present
        update_cache: yes

    - name: Ensure rsyslog is running
      ansible.builtin.service:
        name: rsyslog
        state: started
        enabled: yes

    - name: Create Uptime Kuma data directory
      ansible.builtin.file:
        path: "{{ kuma_data_dir }}"
        state: directory
        owner: root
        group: root
        mode: '0755'

    - name: Copy backup file from AWX to Witness
      ansible.builtin.copy:
        src: "{{ local_temp_backup }}"
        dest: "{{ kuma_data_dir }}/kuma.db" # This restores the backup
        owner: root
        group: root
        mode: '0644'

    - name: Get the host system timezone # Required for fail2ban to work in Docker for uptimekuma
      ansible.builtin.command: cat /etc/timezone
      register: host_tz_output
      changed_when: false # Don't report this as a "change" in the summary

    - name: Start Uptime Kuma container
      community.docker.docker_container:
        name: uptimekuma
        image: louislam/uptime-kuma:2 # Version 2.x.x
        state: started
        pull: true # Always pull it in case there is an updated version
        restart: true  # Restart the service after the DB is restored
        restart_policy: always
        ports:
          - "3001:3001"
        volumes:
          # This maps the host dir (with your .db) into the container
          - "{{ kuma_data_dir }}:/app/data"
          - "/etc/timezone:/etc/timezone:ro" # Sync time with host
          - "/etc/localtime:/etc/localtime:ro"
        tty: false             # Tells app 'you are not in a terminal'
        interactive: false     # Disables interactive mode
        env:
          TZ: "{{ host_tz_output.stdout }}"
          NO_COLOR: "1" # to avoid binary output in systemd to ensure logs will flow to fail2ban
          FORCE_COLOR: "0"     # stronger disable for Node.js/Chalk
        log_driver: syslog # Avoid using systemd as it cannot process blob data from Node
        log_options:
          tag: uptimekuma  # Tag the logs so Fail2Ban can find them

    - name: Create the garb check script
      ansible.builtin.copy:
        dest: /usr/local/bin/check_garb.sh
        mode: '0755'
        owner: root
        group: root
        content: |
          #!/bin/bash
          # Managed by Ansible - Do Not Edit Manually

          PUSH_URL="{{ garb_push_url }}"
          SERVICE="garb"

          # Check if service is active
          if systemctl is-active --quiet "$SERVICE"; then
              # Service is UP. Send heartbeat.
              # -m 10: Max 10 seconds wait
              curl -fsS -m 10 "$PUSH_URL" > /dev/null 2>&1
          fi

    - name: Add cron job for garb check
      ansible.builtin.cron:
        name: "Check Galera Arbitrator"
        minute: "*/2" # Run every two minutes
        job: "/bin/bash /usr/local/bin/check_garb.sh"
        user: root
        state: present

    - name: Create the Cluster Size check script (High Availability) for UptimeKuma
      ansible.builtin.copy:
        dest: /usr/local/bin/check_cluster_size.sh
        mode: '0755'
        owner: root
        group: root
        content: |
          #!/bin/bash
          # Managed by Ansible
          # This script checks multiple nodes for redundancy

          HOSTS="{{ db_monitor_hosts }}" # This injects the db_monitor_hosts variable
          DB_USER="{{ db_monitor_user }}"
          DB_PASS="{{ db_monitor_pass }}"
          PUSH_URL_BASE="{{ cluster_push_url | split('?') | first }}"

          SIZE=""

          # Loop through the hosts
          for HOST in $HOSTS; do
              # Try to get the size.
              # -s: Silent, -N: Skip headers
              # --connect-timeout=3: Fail fast (3 seconds) if node is down
              TEMP_SIZE=$(mariadb -h $HOST -u "$DB_USER" -p"$DB_PASS" -s -N --connect-timeout=3 -e "SHOW STATUS LIKE 'wsrep_cluster_size';" 2>/dev/null | awk '{print $2}')

              if [[ -n "$TEMP_SIZE" ]]; then
                  SIZE=$TEMP_SIZE
                  # We got a valid number, stop looking!
                  break
              fi
          done

          # Check if we got a result from ANY node
          if [[ -z "$SIZE" ]]; then
              # If we are here, ALL nodes failed to respond
              echo "Cluster unreachable"
              curl -fsS "$PUSH_URL_BASE?status=down&msg=Connection%20Failed%20(All%20Nodes)&ping=" > /dev/null
              exit 1
          fi

          # Logic: Is size >= 5?
          if [ "$SIZE" -ge 5 ]; then
              # STATUS OK
              curl -fsS "$PUSH_URL_BASE?status=up&msg=Cluster%20Size:%20$SIZE&ping=" > /dev/null
          else
              # STATUS DEGRADED
              curl -fsS "$PUSH_URL_BASE?status=down&msg=Degraded%20Size:%20$SIZE&ping=" > /dev/null
          fi

    - name: Add cron job for Cluster Size check
      ansible.builtin.cron:
        name: "Check Galera Cluster Size"
        minute: "*/2" # Run every two minutes
        job: "/bin/bash /usr/local/bin/check_cluster_size.sh"
        user: root
        state: present

    # Create the Filter for Fail2ban to recognize Uptime Kuma logs
    - name: Create Fail2Ban filter for Uptime Kuma
      ansible.builtin.copy:
        dest: /etc/fail2ban/filter.d/uptimekuma.conf
        owner: root
        group: root
        mode: '0644'
        content: |
          [Definition]
          # Since Node.JS 'colors' the output, it is safer to use these phrases
          # You can simulate failed logins and then check: sudo tail -f /var/log/syslog | grep uptimekuma
          # Match lines regardless of color codes or prefixes
          # We search for "[AUTH]" and the specific error messages
          failregex = Incorrect username or password.*IP=<HOST>
            Invalid token provided.*IP=<HOST>
            Too many failed requests.*IP=<HOST>
          ignoreregex =
    # Create the jail for Uptime kuma
    - name: Create Fail2Ban jail for Uptime Kuma
      ansible.builtin.copy:
        dest: /etc/fail2ban/jail.d/uptimekuma.local
        owner: root
        group: root
        mode: '0644'
        content: |
          [uptimekuma]
          enabled = true
          # Force polling to ensure we catch file updates ('auto' does not work with uptimekuma)
          backend = polling
          # Read from standard system log where Docker/Rsyslog writes
          logpath = /var/log/syslog

          # Chain must be DOCKER-USER to block traffic before it reaches the container
          chain = DOCKER-USER
          port = 3001
          protocol = tcp

          # Ban Action
          action = iptables-allports[name=uptimekuma, chain=DOCKER-USER]

          # Ban Policy
          maxretry = 4
          findtime = 120
          bantime = 360
      notify: Restart Fail2Ban

  handlers:
    - name: Restart Fail2Ban
      ansible.builtin.service:
        name: fail2ban
        state: restarted

- name: 3. Clean Up Backup (on AWX)
  hosts: localhost
  connection: local
  gather_facts: no
  become: false

  tasks:
    - name: Remove local backup file from AWX
      ansible.builtin.file:
        path: "/tmp/kuma.db"
        state: absent
Play 1: The "Staging" Phase (Localhost)
- Goal: Fetch the backup file securely from the cloud to the Ansible Controller (AWX).
- The challenge: We don't want the remote VPS to have direct access to our Google Cloud bucket credentials. Instead, AWX acts as the secure middleman.
- Target:
localhost(The AWX Execution Environment). - Privileges:
become: false(We don't need root to download a file). - The Tech: We use the
google.cloud.gcp_storage_objectmodule.- It connects to your bucket (
proxmox-backup-bachelor). - It authenticates using a Service Account injected securely by AWX env vars.
- It downloads
kuma.dbto a temporary location (/tmp/kuma.db) on the AWX runner.
- It connects to your bucket (
Tip: Check the variables! We define the bucket name and object path as variables at the top so they are easy to change later without breaking the logic.
Play 2a: Kuma Restoration Phase (Remote VPS)
This is where the magic happens on the remote server (galera-witness-hetzner).
-
Goal: Upload the database, launch the container, and set up a "Dead Man's Switch" for the Galera service.
-
The Kuma DB Restore part:
- Directory Setup: We ensure
/opt/uptimekumaexists with correct permissions. - The Tech: We use
ansible.builtin.copyto move thekuma.dbfrom the AWX controller (local) to the remote VPS. - Note: This restores the dashboard(s), notifications and history instantly, although the service needs to be restarted.
- Directory Setup: We ensure
-
The Container Launch:
- Goal: We use the
community.docker.docker_containermodule to spin up Uptime Kuma. - Version Control: We explicitly pull
louislam/uptime-kuma:beta. - Note: If you use v1, then instead of
beta, put a1.
- Goal: We use the
-
Persistence: We mount the host directory (
/opt/uptimekuma) to/app/datainside the container. -
Networking: We expose port
3001so we can access the dashboard via the VPN tunnel. -
Time sync: We mount the host's timezone files into the container. This is critical for
fail2ban.
Play 2b. The Self-Monitoring Setup (The Push Monitor)
We need this node to scream if the critical Galera Arbitrator (garb) service crashes. Since a Docker container cannot easily see host processes, we use a Push Monitor.
- Note the Jinja2 Trick - we define the Push URL variable using Jinja2 concatenation:
garb_push_url: "{{ 'http://127.0.0.1:3001/...' + '...' }}"- Why? YAML struggles with long lines. This splits the URL cleanly without introducing accidental spaces or newlines that would break the link.
- The Script (
check_garb.sh): ansible writes a bash script directly to/usr/local/bin/.- It runs
systemctl is-active --quiet garb. - If UP: It sends a "heartbeat" (curl request) to the local Uptime Kuma container.
- If DOWN: It does nothing. Uptime Kuma notices the silence and sends an alert.
- It runs
- You might ask why not to do more than just to check for the service being up, such as by running
SHOW STATUS LIKE 'wsrep_cluster_size';to see that the output shows the desired number for connected galera nodes? The challenge is that thegarbservice does not have the requiredmariadb-clientpackage. - The Cron Job: We schedule this script to run every 2 minutes (
*/2) via the root crontab. This ensures we are alerted quickly if the cluster witness goes down.
Play 2c: Set up jail and log monitoring
- Log Management: Installs
rsyslogand configures Docker to send Uptime Kuma logs to the system syslog. This bypasses binary logging issues withjournald. - Fail2Ban Filter: Creates a custom filter using Regex to identify failed login attempts in the logs, ignoring ANSI color codes sent by the Node.js application.
- Fail2Ban Jail: Configures a jail that bans offending IPs by manipulating the
DOCKER-USERiptables chain, effectively blocking traffic before it even reaches the container.
Play 2d: The High Availability monitoring script
- Cluster Health Check: Deploys a bash script that uses
mariadb-clientto connect to Site 1 or Site 2 databases over the VPN. - Logic: It queries
wsrep_cluster_size. If the size is < 5, it pushes a "Down" signal to Uptime Kuma. If it cannot connect to any node, it reports a connection failure.
Play 3: Clean up on AWX
- Run a clean up on the
localhost(not on the VPS) to remove the previously downloadedkuma.db. - This step is optional, it is just to keep things tidy 😇
Create a third job template in AWX
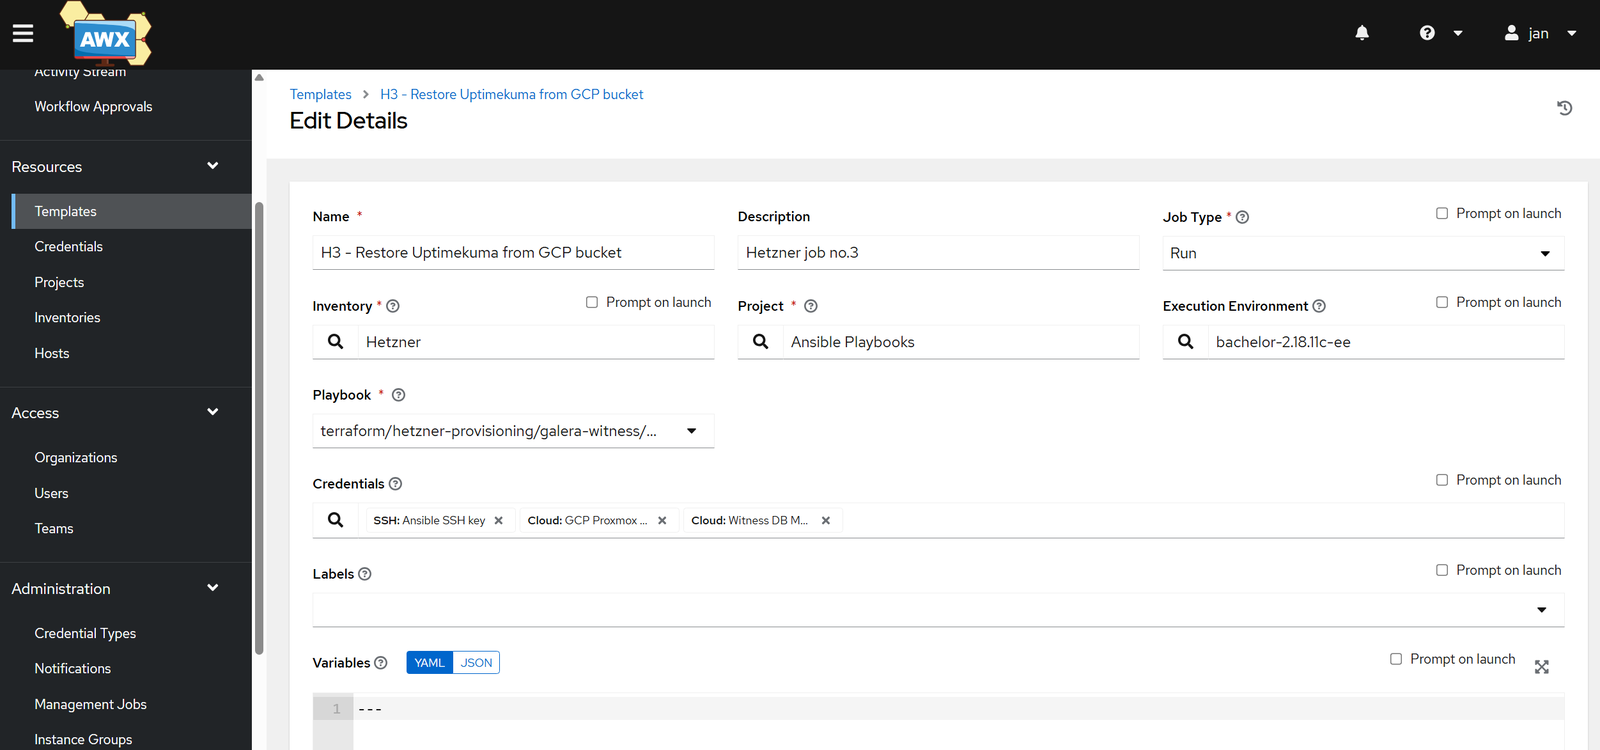
- Navigate to AWX: Go to Resources -> Templates. Click on the Add -> Add job template.
- Name:
H3 - Restore Uptimekuma from GCP bucket - Job Type:
Run - Inventory:
Hetzner(the same inventory used by your other jobs) - Project: Select the project containing your playbooks.
- Playbook:
restore-uptimekuma.yml - Execution Environment: Your custom EE (with
google.cloudandcommunity.docker). - Credentials: select your Ansible SSH and
GCP UptimeKuma BackupandWitness DB Monitor. - Variables: none, as we have the safe-to-share ones already in Gitea
- Privilege Escalation:
tickthe box, as play 2 uses the ‘become: true’ parameter.
- Name:
- Click Save. Do not launch it just yet, as it will only work once chained with the [1] Provisioning and [2] Configuring job.
Troubleshooting the 3rd template
- Problem 1: Uptimekuma works on
http://public_ip:3001but the Uptimekuma push script is not working.
# Verify the push URL matches the one in your UptimeKuma instance in your VM (owned by root)
sudo nano /usr/local/bin/check_garb.sh

# Verify that the crontab job is present (owner by root)
sudo nano crontab -e

# If the container is in a restart loop and logs show permission errors,
# ensure the /opt/uptimekuma directory is owned by user 1000 (node):
chown -R 1000:1000 /opt/uptimekuma- Problem 2: Unreachable database - if the uptimekuma monitor for checking the size of the cluster fails, try reaching it manually from your VPS - either there is a firewall rule in the way or the credentials are incorrect:
# Firstly, see if you can reach the DB
mariadb -h $HOST -u "$DB_USER" -p"$DB_PASS"
exit;

# Run this from your VPS to ensure connection can be established for y our monitoring user:
mariadb -h $HOST -u "$DB_USER" -p"$DB_PASS" -s -N --connect-timeout=3 -e "SHOW STATUS LIKE 'wsrep_cluster_size';" | awk '{print $2}'
# Fill in the variables above and see if you get the desired output in the form of a number.- Problem 3: Uptime Kuma not starting - most likely, a DB corruption issue.
- Most likely, this is because you re-ran the third job and did not flush the
/opt/uptimekumacontent after removing the container. - If the container is in a restart loop and logs show permission errors, ensure the
/opt/uptimekumadirectory is owned by user 1000 (node) usingchown -R 1000:1000 /opt/uptimekuma. - Check the logs:
- Most likely, this is because you re-ran the third job and did not flush the
# Check the uptimekuma logs
sudo docker logs --tail 50 uptimekuma

# Look for lines like these:
2025-11-18T22:30:51Z [DB] INFO: Database Type: sqlite
2025-11-18T22:30:51Z [SERVER] INFO: Connected to the database
2025-11-18T22:31:19Z [DB] ERROR: Database migration failed
2025-11-18T22:31:19Z [SERVER] ERROR: Failed to prepare your database: INSERT INTO "_knex_temp_alter332" SELECT * FROM "stat_hourly"; - SQLITE_CORRUPT: database disk image is malformed

# Fix it by deleting the SQLite files to force a recovery
sudo docker stop uptimekuma

# This is safe to delete when the service is stopped
sudo rm /opt/uptimekuma/kuma.db-wal
sudo rm /opt/uptimekuma/kuma.db-shm

sudo docker start uptimekuma
7. Create a Workflow Template to join the 3 jobs
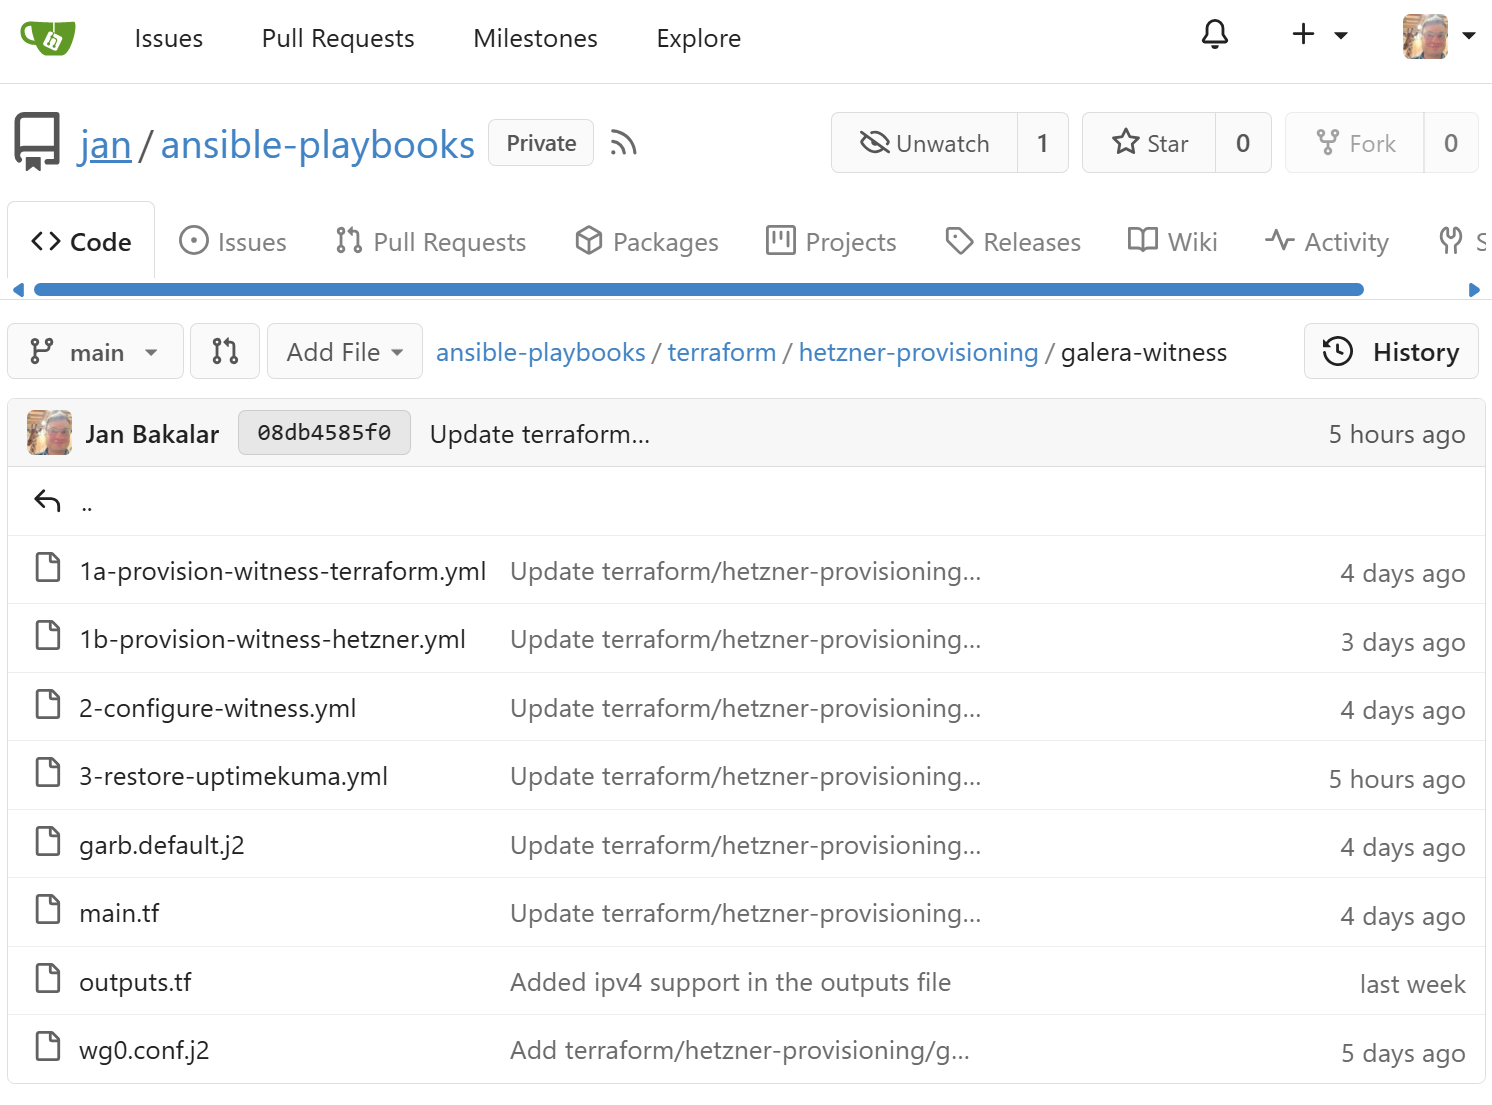
- The final state of files in Gitea should look like this:
- We can now join the provisioning and the configuration jobs together. Once the VPS is provisioned in Hetzner, it will then be configured with the S2S VPN details as well as
garbdconfig. - In AWX, go to Templates → click on the Add button and choose ‘Add workflow template’ from the drop-down button.
- Name:
H0 - Workflow - Provision + Configure Galera Witness - Description:
Executed on Hetzner - a VPS is created and set up - Inventory:
Hetzner
- Name:

- Then you will be taken to the Visualizer.
- Add the jobs from H1, H2 to H3.
- Chain them with the condition for the next step to be triggered only ‘on success’ after the previous job finished.

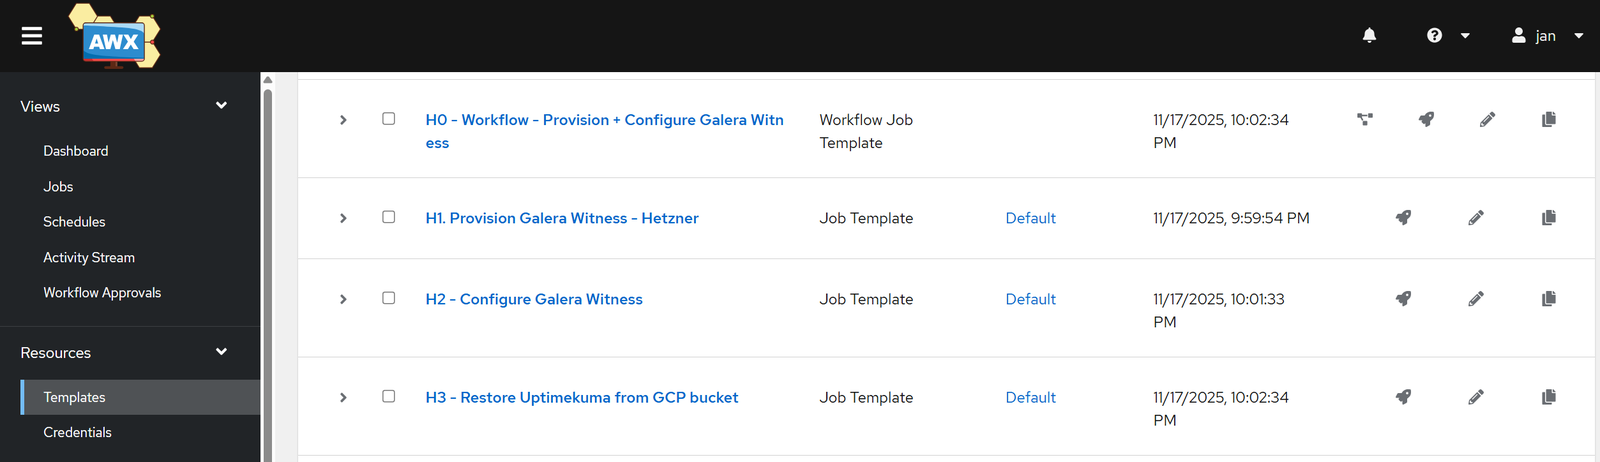
- If you got back to Templates, it may look something like these four below:
- Then finally, LAUNCH the workflow template!
- The second template will take the longest time to run (about 3 minutes) because it waits for the first one to finish running the
cloud-inittemplate before proceeding further.
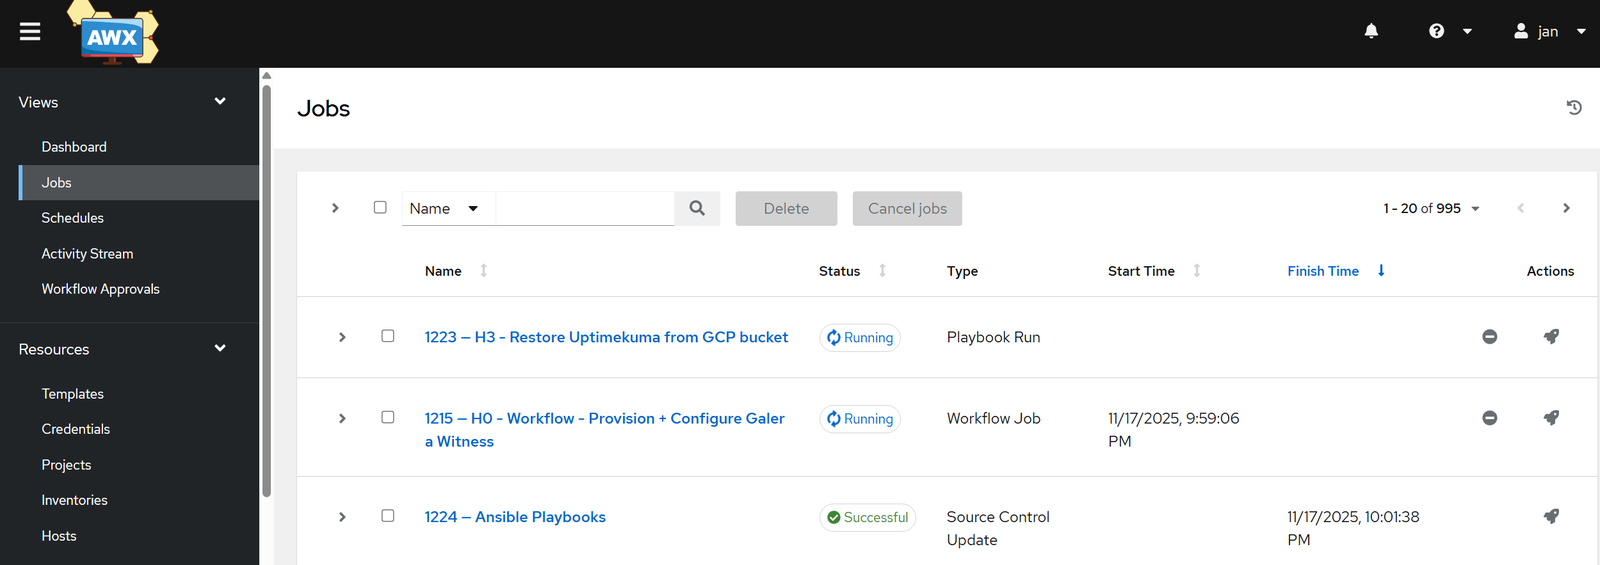
- Once the third template runs, you can start checking for the Uptimekuma service on
http://public_ip:3001. If you would like to go fancy and have it set up with HTTPS, let me know in the comments and I can update the steps. Upon logging in, if not done already, I would recommend you to set up 2FA, since this service is exposed to the world. - Tell me, is it not absolutely beautiful to deploy a VPS with a click of a button and have it set up with all required services and monitoring? Note the reported cluster size in the Message field. Isn’t that neat? Anything smaller than 5 will result in an alert about the cluster being down. With all nodes being up, the cluster size should read 9 (4x on Site 1 + 2x on Site 2 + 1x Witness on Site 3).

- I recommend verifying that fail2ban for Uptime Kuma works as expected. What you can do is to SSH in and run the following commands while trying to login in repeatedly using bogus credentials.
# Watch the logs as you try logging in with bogus credentials:
sudo tail -f /var/log/syslog | grep uptimekuma

# Once you are jailed, you should be able to see it on the status page:
sudo fail2ban-client status uptimekuma

# Unban your public IP address:
sudo fail2ban-client set uptimekuma unbanip 1.2.3.4
This concludes our rather extensive guide. Hopefully there was something new and interesting in there for you to learn without being overwhelming? In case you are missing some required parts in your infrastructure to make it happen, check out my other Tutorials!
Let me know in the comments below how your journey with Ansible and multi-site deployment of Galera in a hybrid infrastructure environment went 😇
Enjoying this tutorial?
This site is a non-profit project. If it saved you some time, you can support it by getting Jan some coffee.
☕ Buy me a coffee
Comments