Part 2 - Configure HAProxy, test the cluster and set up monitoring
Go to previous section Download Markdown Go to next section
October 29, 2025
Table of Contents
Configure HAProxy for your Galera Cluster
- In this scenario, we are setting up HAProxy on OPNSense, where it is available as a plugin. If you have a different reverse proxy or have HAProxy deployed in a different way, you can try following the steps before, although it may differ.
- In case you do not yet have HAProxy installed/enabled on your OPNSense, go ahead to ‘System’ → ‘Firmware’ → ‘Plugins’ and download it.

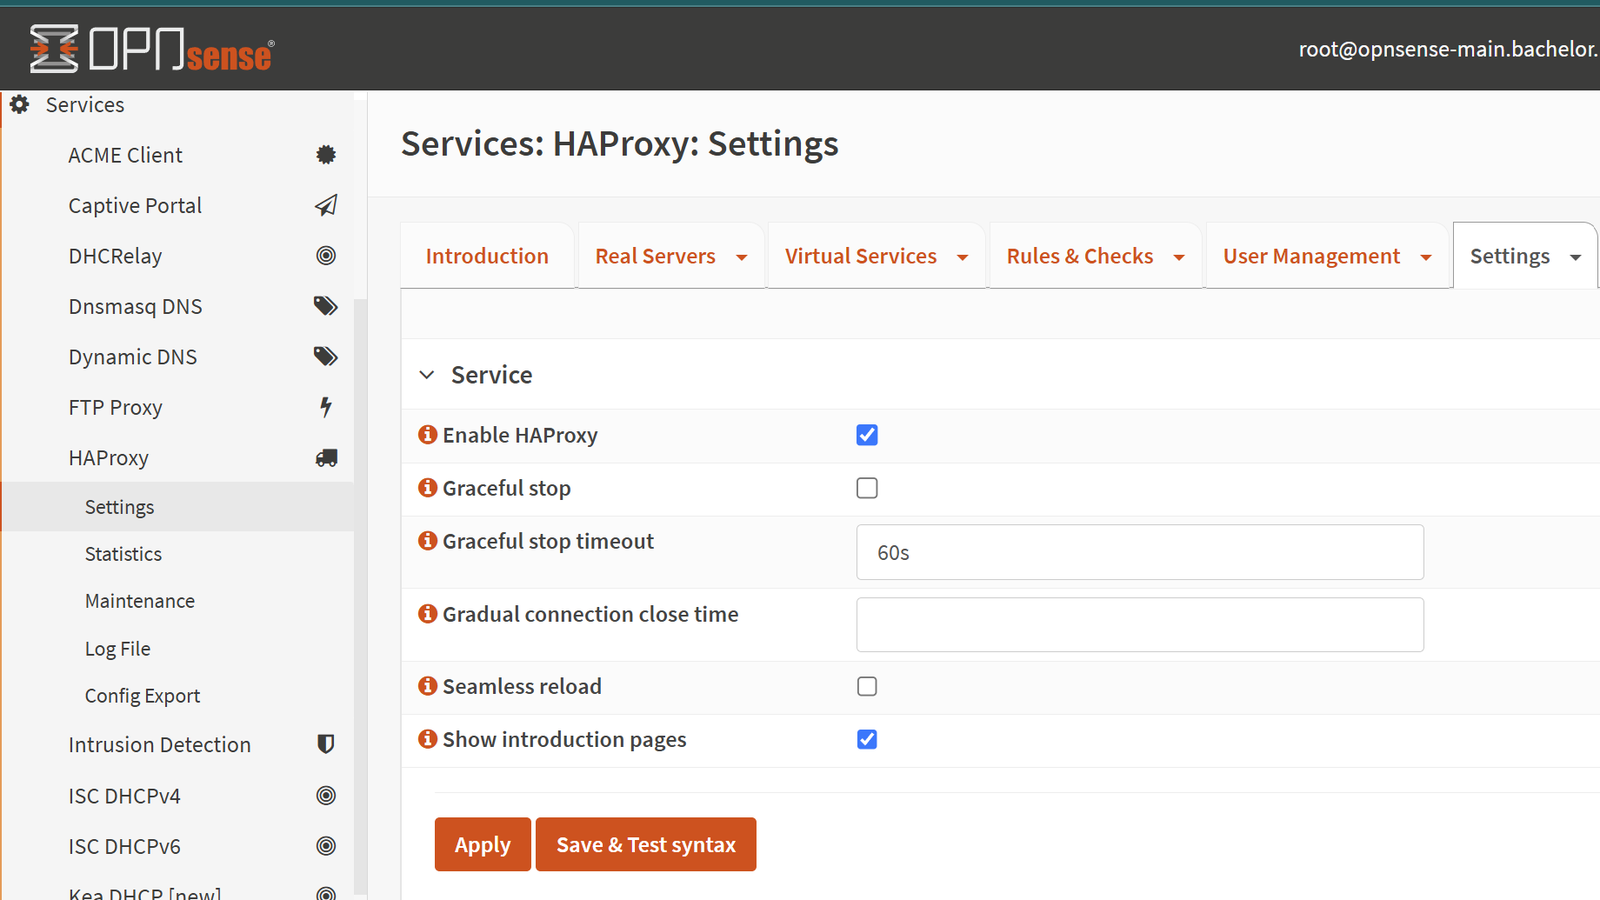
- Log into OPNSense and go to ‘Services’ → ‘HAProxy’ → ‘Settings’. Then again to ‘Settings’ → ‘Service’ to ensure that the service is running.
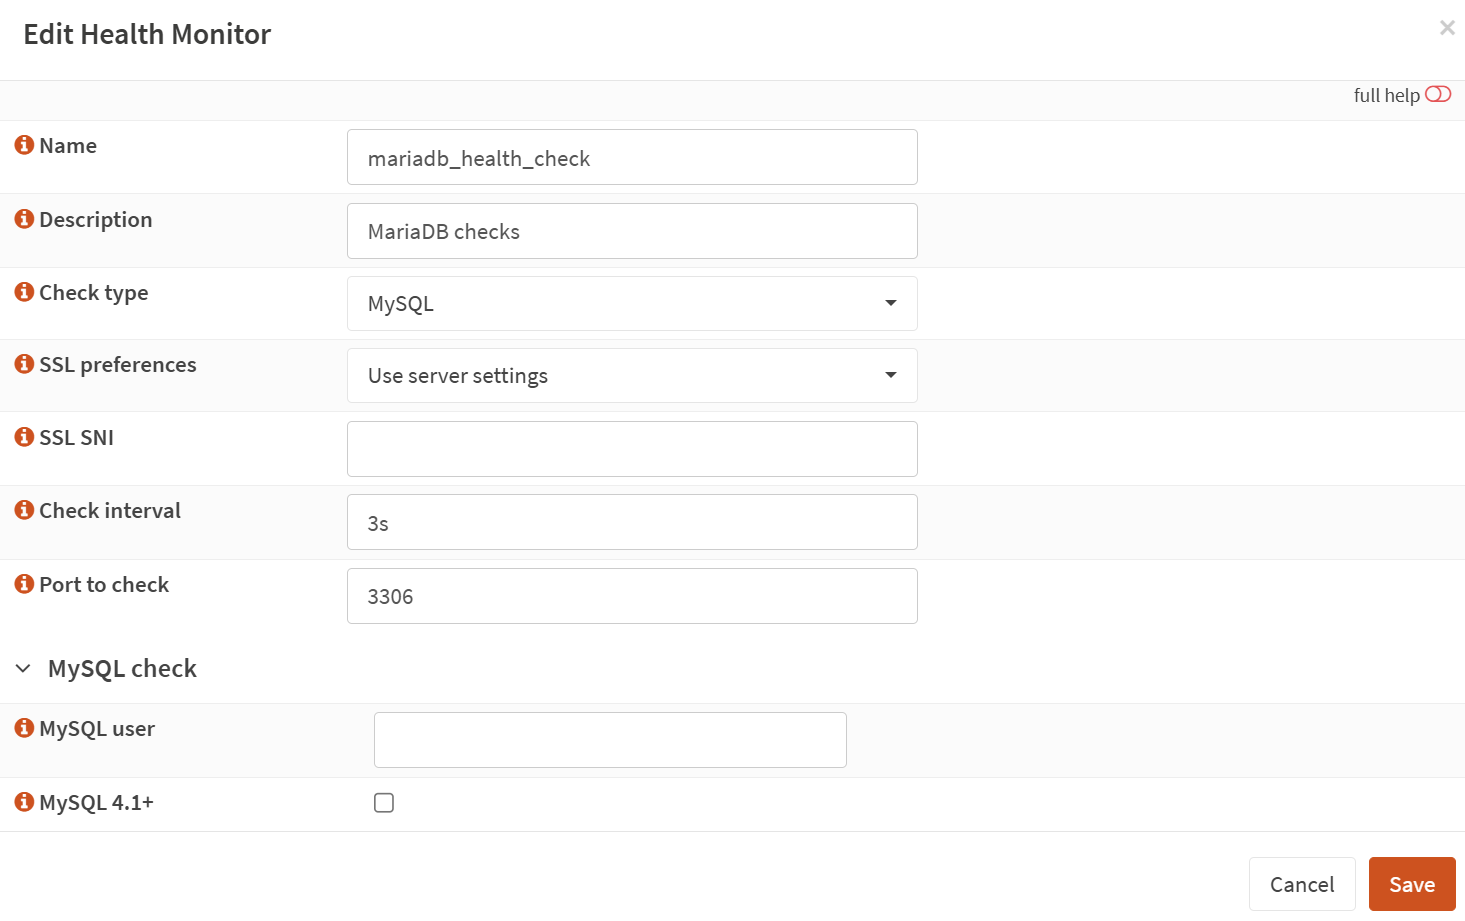
- Create a health check for the MySQL service that MariaDB needs:
- In the top menu, go to ‘Rules & Checks’ → ‘Health Monitors’
- Click on the + sign to add a new one (this button is a bit less visible).
- Name/Description: as you like, such as mariadb_health_check
- Check type: MySQL
- Check internal 3s (or as you prefer)
- Port: 3306
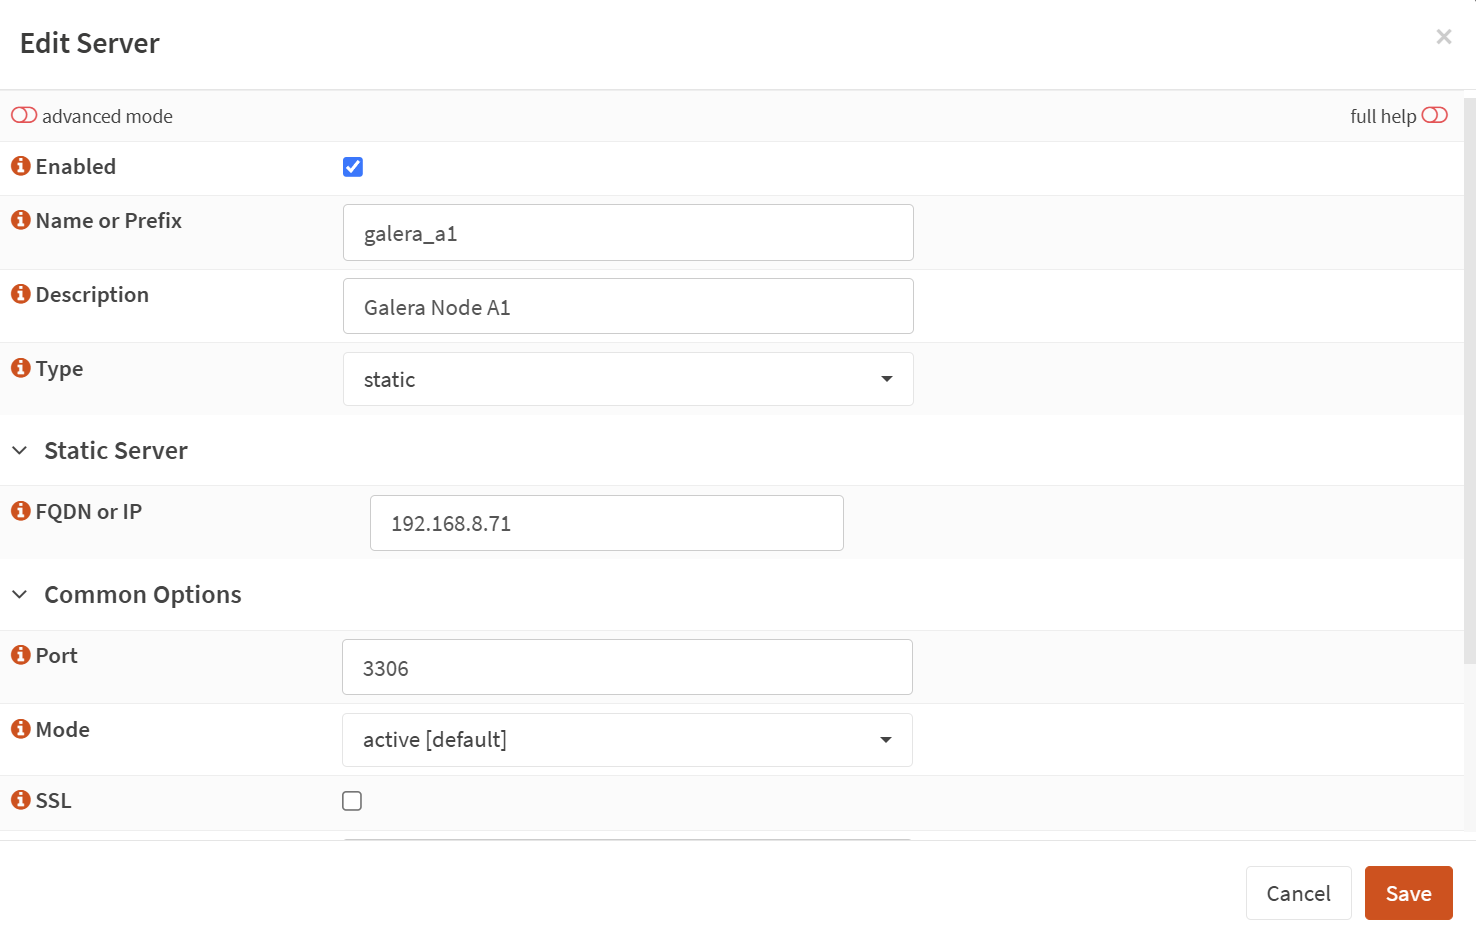
- Now let’s make HAProxy aware of each container’s existence. While still in ‘Services’ → ‘HAProxy’ → ‘Settings’ in the left menu, go to ‘Real servers’ → ‘Real servers’ drop-down option. Click on the + sign to add a new one for each instance.
- Name: name of each galera instance, such as galera_a1
- Type: static
- IP: the real IP of each instance
- Port: 3306 (optional, since our health check has it configured already)
- Mode: active
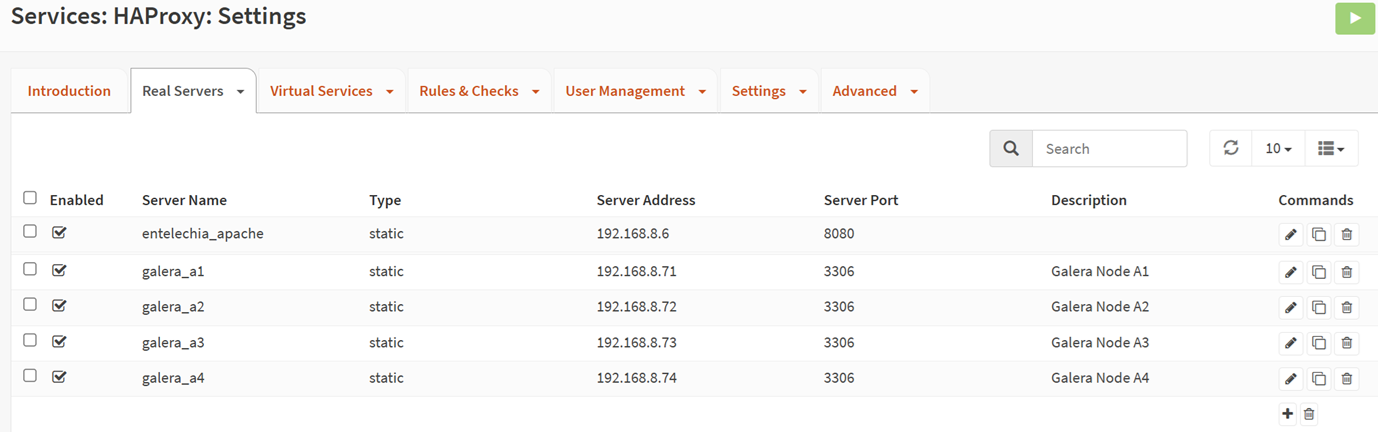
- In the end, you should have all four listed:
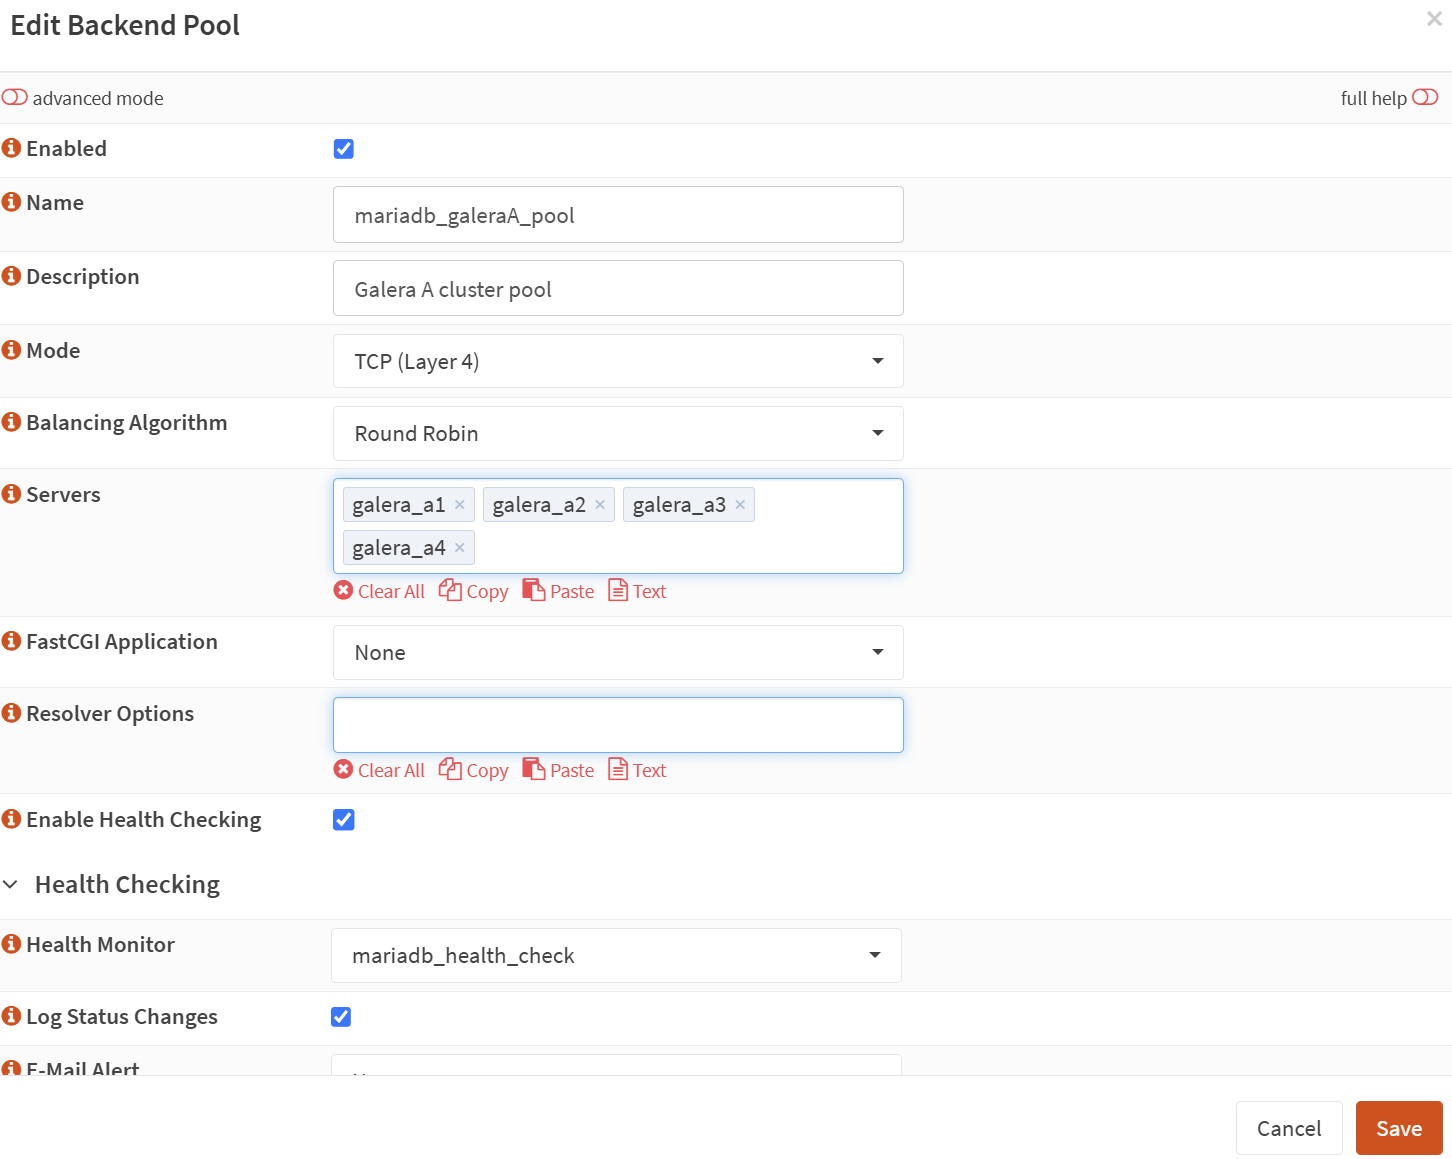
- The next step is to create a backend pool. Go to ‘Virtual Services’ → ‘Backends’ and click on the + sign again.
- Name/Description: As per your preference, such as mariadb_galeraA_pool
- Mode: TCP
- Algorithm: Round robin
- Servers: list all your MariaDB containers that you want in there
- Tick box for Health Checking
- Tick ‘Log status Changes’ if you would like to.
-
At this point, it would be good after saving this change to click on the ‘Test syntax’ button to ensure that there are no errors and then you can click on the ‘Apply’ button.
-
So now HAProxy knows what to check and where and how often. Yet, for our web apps, we would want a single point of contact. We will need a virtual IP address.
-
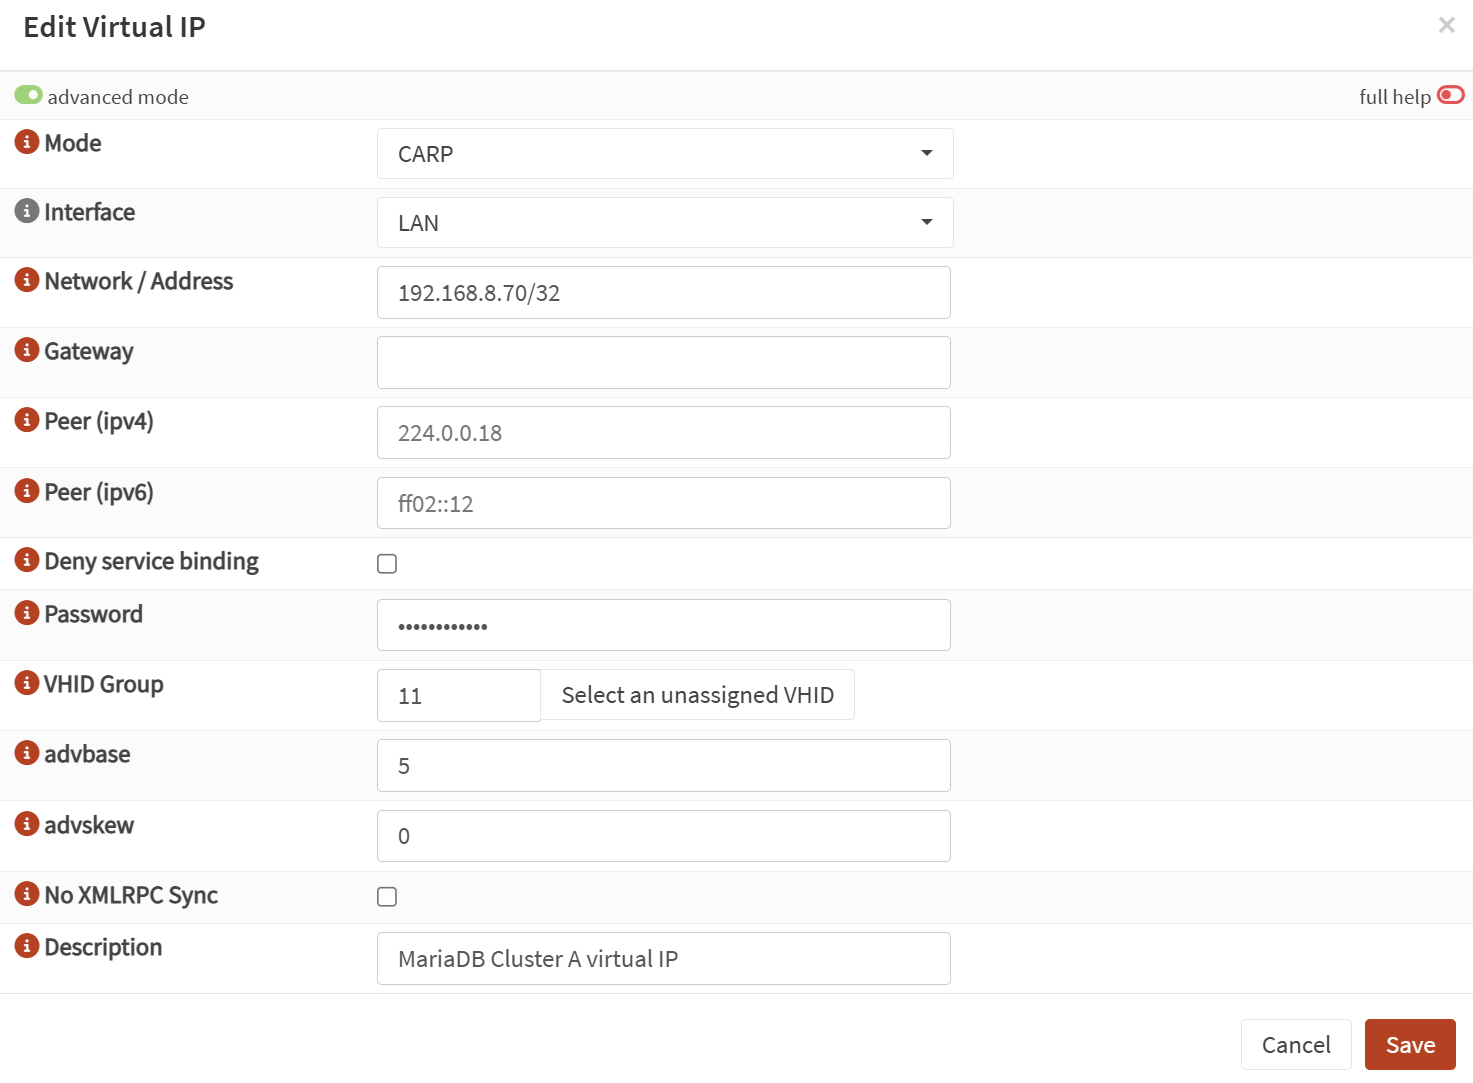
In the left menu of your OPNSense, go to ‘Interfaces’ → ‘Virtual IPs’ → ‘Settings’ and click on the + sign to add a new one.
- Mode: CARP (as we have OPNSense in a HA cluster already and want them to take over in case one fails)
- Interface: LAN
- Network address: Choose an address on your LAN that is not on your DHCP range (mine starts from .101 onwards). The subnet should be specific to that IP only, i.e. /32.
- Set up a custom password - if you have more OPNSense units, it needs to match on all instances.
- VHID: needs to be unique from others and match with other OPNSense units in the cluster (if you have one).
- advbase: same as above
- advskew: The main unit should have a lower value, the secondary (backup) unit(s) higher value(s).
-
Check out my previous article on how CARP and HA works on OPNSense for more details.
- You might object why to add another CARP interface when you already have your OPNSense in a cluster (and if not, why not - just follow this guide). This is the cleanest way of separating our network's gateway IP from our database service IP. If we ever need to add firewall or NAT rules in the future, we can simply refer to this virtual IP.
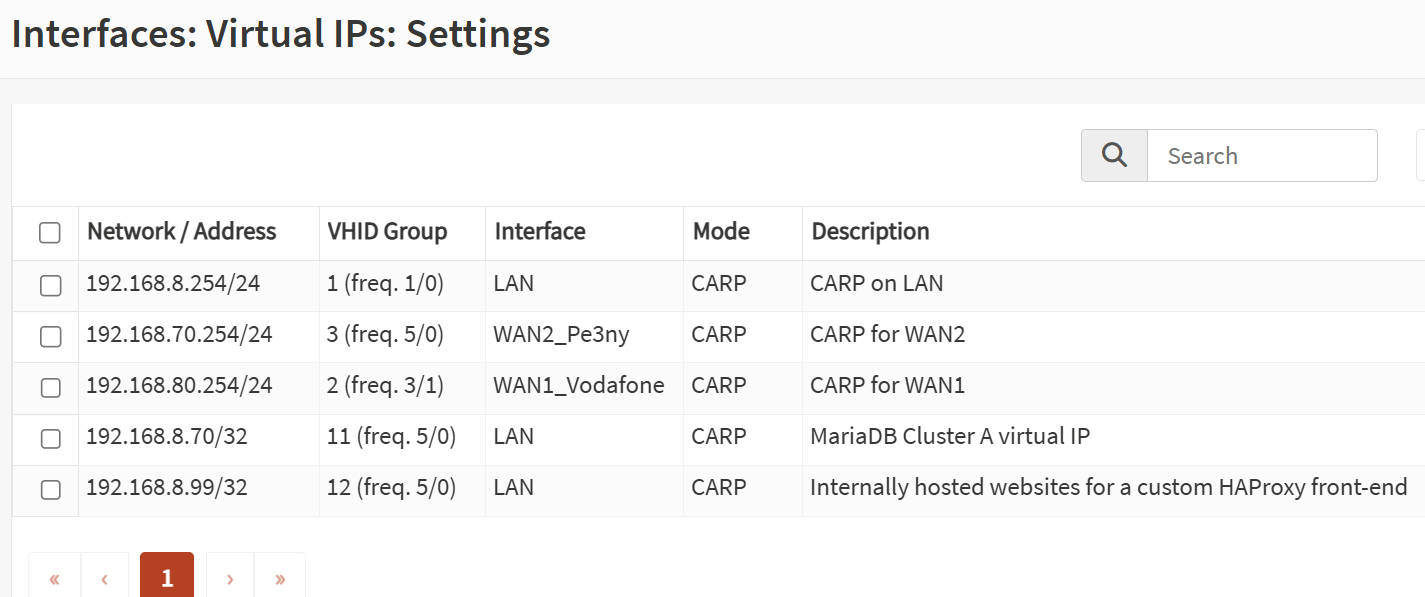
- This is how it looks on my end after configuring the virtual IP for the Galera DB service:
- Finally, we can head back to HAProxy via ‘Services’ → ‘HAProxy’ → ‘Settings’ and find the ‘Virtual Services’ in the top menu and select ‘Public Services’ from the drop-down. Click on the + sign.
- Name/Description: As per your preference, something like ‘galera_db_cluster_listener’ may do.
- Listen address: your virtual IP
- Type: TCP (not HTTP!)
- Default back-end pool: our previously configured pool, e.g. ‘mariadb_galeraA_pool’.

- After saving it, testing the syntax and applying, it would be good to ensure that this new config gets replicated to the other OPNSense instance in HA that we have configured in our previous guide.
- Head to ‘System’ → ‘High Availability’ → ‘Status’.
- Click on the button to the right of ‘Synchronize config to backup’.

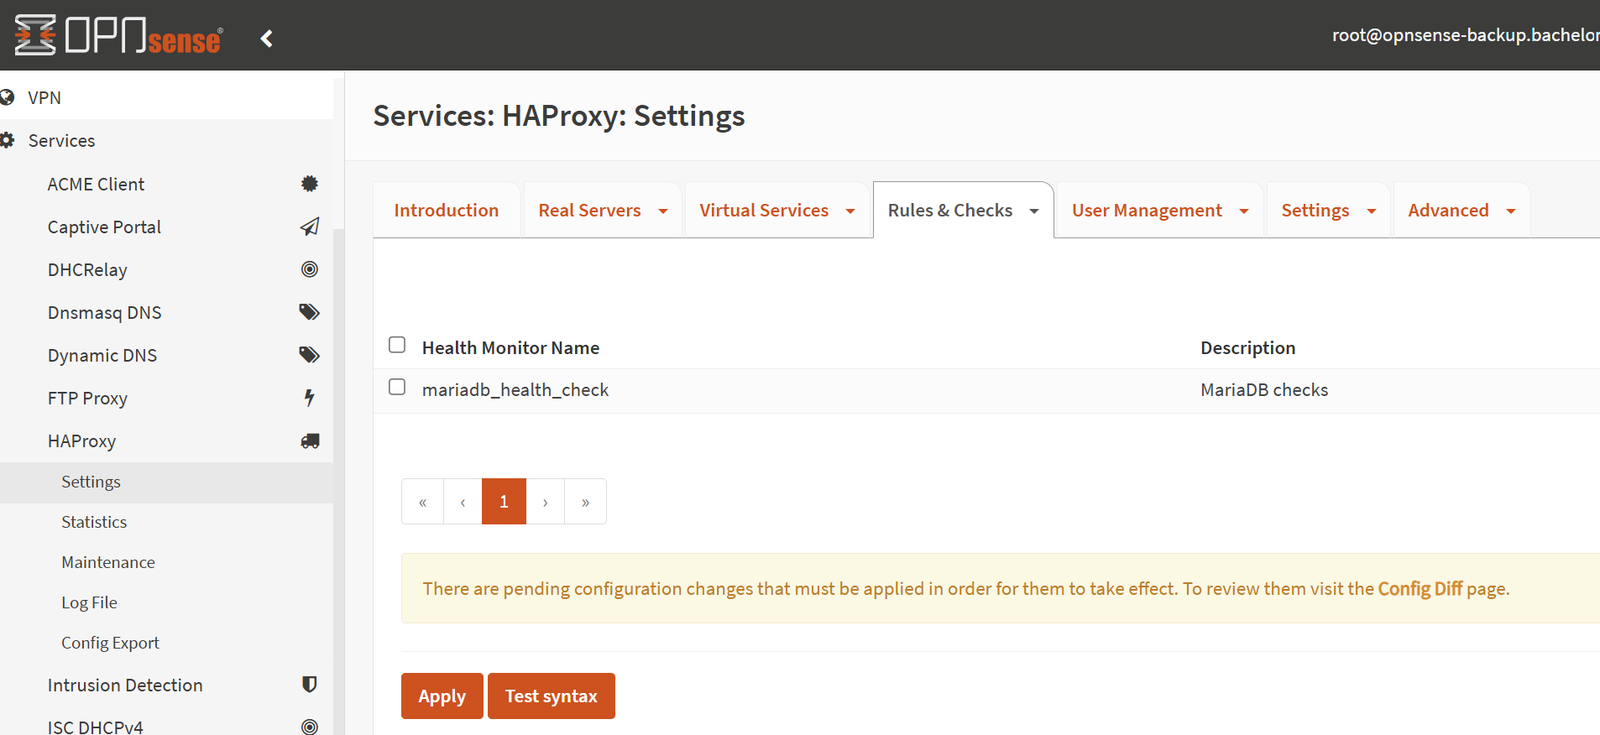
- Then it would be good to log into your backup instance(s) to confirm that all the HAProxy and virtual IP config is in there. Esp. in HAProxy, it is often necessary to apply the new configuration:
- Now we are talking! Let’s run some tests to confirm it is working as expected.
Testing your Galera MariaDB cluster & Troubleshooting
- Note: the
haproxy_checkuser created earlier is scoped to only log in from the OPNSense nodes' own IPs (opnsense_node1_ip_here/opnsense_node2_ip_here), that's deliberate, it's a health-check account, not a general-purpose one. Run the test below from one of those OPNSense nodes, not from an arbitrary machine, or it will fail to authenticate. - Connect to any Linux machine that has MariaDB client installed, run the following (using the user we created earlier for this type of tests):
mariadb -h 192.168.8.70 -u haproxy_check -p -e "SELECT @@wsrep_node_name;"- The output will reveal which instance is being queried. If you run it repeatedly, you will get the same result due to stick-table persistence.

- If you try connecting from another instance, you will likely reach another one, instead:

- This confirms that the round-robin works for each new client connecting.
Hardware Set up for the Pi
- Grab a Raspberry Pi (any version will do if it's not already busy with other tasks).
- The Pi should be connected ideally via the same switch as the Proxmox nodes on the same network for low latency. I would not recommend WiFi connection here.
- The OS is up to your choice, a basic headless Raspberry Pi OS Lite would do. In this guide, I assume it is a Debian-based distro.
- Ideally, have it connected to UPS. Either have one that covers several devices (such as your Proxmox nodes + router(s) + the Pi) or one that is dedicated to the Pi, that is a power bank with UPS capabilities. Ping me for tips if you are struggling to find some 🙂
What to install
- Connect to the Pi via SSH and run the following:
# Update / Upgrade the OS to its newest version
sudo apt update && sudo apt upgrade -y

# Install MariaDB client only (no need for a server)
sudo apt install galera-arbitrator-4 -y- Let’s configure the Arbitrator:
sudo nano /etc/default/garb

# A comma-separated list of other node addresses (IPs) in your Galera cluster.
# At least one of these must be contactable at startup.
GALERA_NODES="<node1_ip>:4567,<node2_ip>:4567,<node3_ip>:4567,<node4_ip>:4567"

# The Galera cluster name such as ClusterA
GALERA_GROUP="my_galera_cluster"

# Optional: log file for garbd. Leave it commented out or
# you will run into permission issues.
LOG_FILE="/var/log/garbd.log"- Save and exit and then enable the garbd service:
# Set the owner of the log file:
chown _galera /var/log/garbd.log

# Set up logrotate
sudo nano /etc/logrotate.d/garbd

/var/log/garbd.log {
    weekly
    rotate 4
    compress
    delaycompress
    missingok
    notifempty
    create 644 _galera mysql
}

# Test it
sudo logrotate -d /etc/logrotate.conf

# Start the garbd service
sudo systemctl start garbd

# Verify the service is up and running
sudo systemctl status garbd

# Set it up to auto-start on boot
sudo systemctl enable garbd

# Monitor the log
# tail -f /var/log/garbd.log- Log into any of your actual MariaDB nodes and check the cluster size.
mysql -u root -p -e "SHOW GLOBAL STATUS LIKE 'wsrep_cluster_size';"
- Now our cluster is resilient to a split-brain scenario in case one of the two Proxmox nodes are down.
- In my case, I use the Pi also as a Proxmox backup server with a large 1 TB micro SD A2 card + as a quorum member for the Proxmox nodes + a quorum member for the Galera cluster. Quite neat!
Set up Monitoring - UpTime Kuma
In one of the first steps in this tutorial, we allowed traffic for a network monitoring system. Yet up to this point, we have not set it up. It is important to be aware when one of your cluster nodes (or your Arbitrator) goes down. In this case, I have included a few steps for UpTime Kuma. If you prefer Zabbix or another monitoring system, let me know in the comments and I may include it as well.
- Connect to one of your nodes in the cluster and add a user with sufficient privileges (here we assume that your UpTime Kuma runs on the 192.168.8.x subnet - change it to your own!):
mysql -u root -p

CREATE USER 'uptimekuma'@'192.168.8.0/24' IDENTIFIED BY 'YourUptimeKumaPassword';
GRANT PROCESS ON *.* TO 'uptimekuma'@'192.168.8.0/24';
FLUSH PRIVILEGES;
EXIT;
Why are we scripting it from Uptime Kuma? Isn’t there an easier way?
- Technically, we could just create a TCP monitor for each node and monitor that the MariaDB service is up this way. Yet if a node got out of sync, such a check would not really reveal it.
- You might also argue why not to use the ‘MySQL / MariaDB’ service monitor. The issue is that depending on your level of MariaDB, the driver layer in UpTimeKuma may have compatibility issues: in my testing, I have come across several combinations when it did not work. In addition, it will only work if you are using TLS, as at the time of writing this article, there is no way to tick a box to trust self-signed certs.
- So the script below covers two things: firstly, it runs a TCP scan just like the built-in TCP scan would. And only if it passes, it will use the ‘mariadb-client’ package to connect to each node to check that it reports as in sync. This way, you will just have one monitor per node (and thus only one notification instead of multiple) and this notification will contain the required detail on what is not working.
- Connect to your UpTimeKuma instance via SSH and run the following commands:
sudo apt update
sudo apt install -y mariadb-client

nano /usr/local/bin/check_galera.sh

#!/bin/bash

# --- ARGUMENTS ---
# The Galera node IP to check is passed as the first argument
DB_HOST=$1
# The Uptime Kuma push code is passed as the second argument
KUMA_CODE=$2

# --- CONFIGURATION ---
# The base URL for your Uptime Kuma instance
UPTIME_KUMA_BASE_URL="http://192.168.8.60:3001"
DB_USER="uptimekuma"
DB_PASS="YourUptimeKumaPassword"
# ---------------------

if [ -z "$DB_HOST" ] || [ -z "$KUMA_CODE" ]; then
    echo "Usage: $0 <database_host_ip> <uptime_kuma_push_code>"
    exit 1
fi

# Construct the full push URL dynamically
UPTIME_KUMA_URL="${UPTIME_KUMA_BASE_URL}/api/push/${KUMA_CODE}"

# --- STEP 1: Check if the TCP port is open ---
if ! nc -z -w 3 "$DB_HOST" 3306 > /dev/null 2>&1; then
    # If nc fails, the port is down. Report and exit.
    curl -fsS --retry 3 "${UPTIME_KUMA_URL}?status=down&msg=Port_3306_Down&ping=" > /dev/null
    exit 0 # Exit cleanly since we successfully reported the status
fi

# --- STEP 2: If the port is open, proceed to check the Galera status ---
export MYSQL_PWD="$DB_PASS"
if mysql --skip-ssl -h "$DB_HOST" -u "$DB_USER" -e "SHOW STATUS LIKE 'wsrep_local_state_comment';" | grep -q "Synced"; then
    # If grep finds "Synced", the node is healthy. Push an UP status.
    curl -fsS --retry 3 "${UPTIME_KUMA_URL}?status=up&msg=Synced&ping=" > /dev/null
else
    # If grep does not find "Synced", the node is not healthy. Push a DOWN status.
    curl -fsS --retry 3 "${UPTIME_KUMA_URL}?status=down&msg=Not_Synced&ping=" > /dev/null
fi
unset MYSQL_PWD

# Make the script executable
sudo chmod +x /usr/local/bin/check_galera.sh- Then create a separate "Push" monitor in Uptime Kuma for each node to get a unique URL for each cron line.

- And lastly, edit your crontab and re-use the same script to run for each node, passing its IP address and the unique push code.
# Edit crontab
sudo crontab -e
Check Galera nodes every minute (replace your IP addresses with yours or hostnames
+ add the respective Uptime Kuma passive push code from the generated URL.
-
-
-
-
- /usr/local/bin/check_galera.sh 192.168.8.71 uptime_kuma_push_code1
-
-
-
-
-
-
-
- /usr/local/bin/check_galera.sh 192.168.8.72 uptime_kuma_push_code2
-
-
-
-
-
-
-
- /usr/local/bin/check_galera.sh 192.168.8.73 uptime_kuma_push_code3
-
-
-
-
-
-
-
- /usr/local/bin/check_galera.sh 192.168.8.74 uptime_kuma_push_code4
- /usr/local/bin/check_galera.sh 192.168.8.74 uptime_kuma_push_code4
-
-
-
-
The result in UpTimeKuma is as follows:

Test that the alerts work
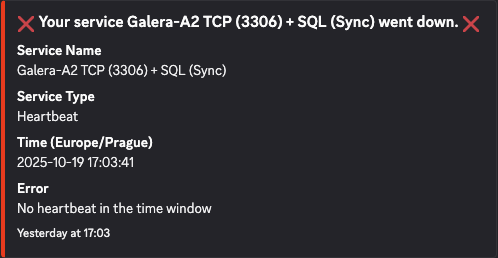
- Connect to one of your nodes and simulate a failure, such as by running sudo
systemctl stop mariadb. - When I disabled mariadb service on node2, here is the error specifying what went wrong:
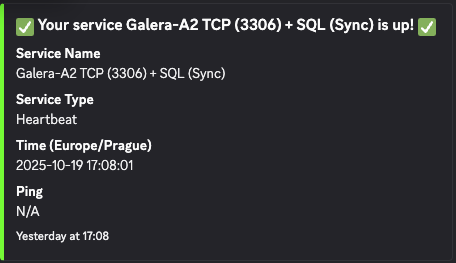
- When I switched it back on (by running
systemctl start mariadb), I got another notification:
- So now that we have a working cluster, ideally with an Arbitrator that is separate from the other physical servers, and we have monitoring in place, it is time to start adding some data to our cluster and entrust it with data!
With the cluster load-balanced, tested and monitored, the last part covers trusting it with real data, recovery options, and self-healing automation.
Enjoying this tutorial?
This site is a non-profit project. If it saved you some time, you can support it by getting Jan some coffee.
☕ Buy me a coffee
Comments