One thing is to get all the data into Grafana. The other is to ensure that you can visualize the data it gathers in one glance.
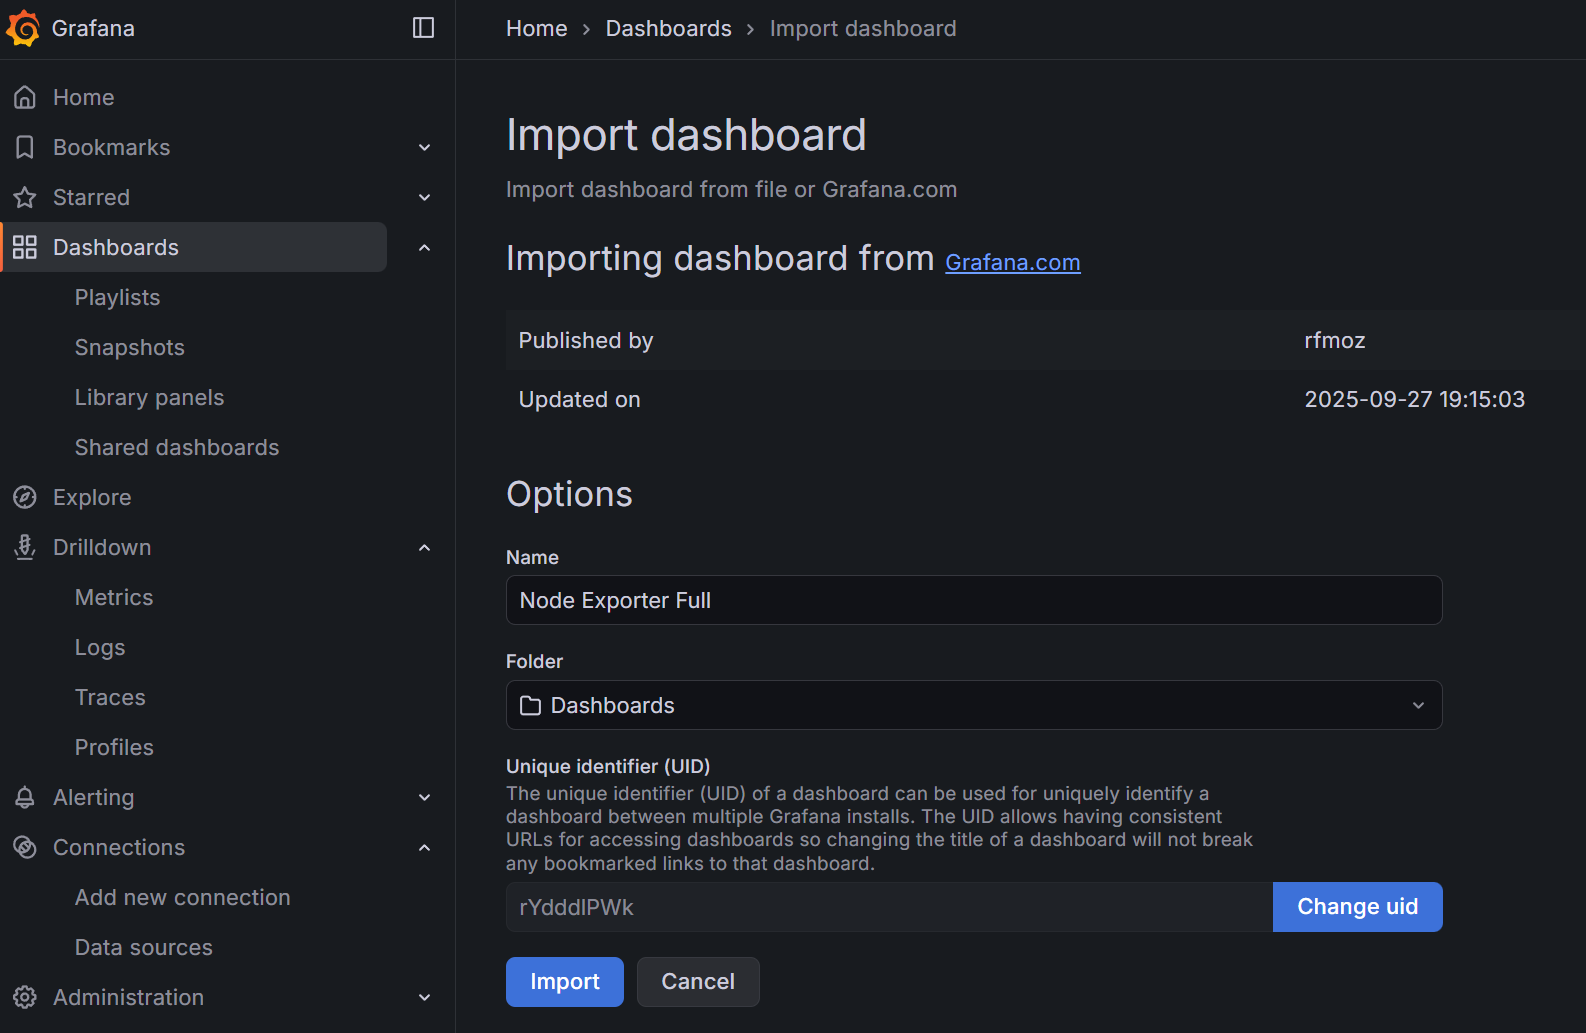
- Go to Dashboards → on the right side, click on the dropdown button and select New → Import.
- Under ‘Find and import dashboards for common applications’, enter ID:
1860(Node Exporter Full) - Click on the Load button
- Select your Prometheus data source
- Click on the Import button
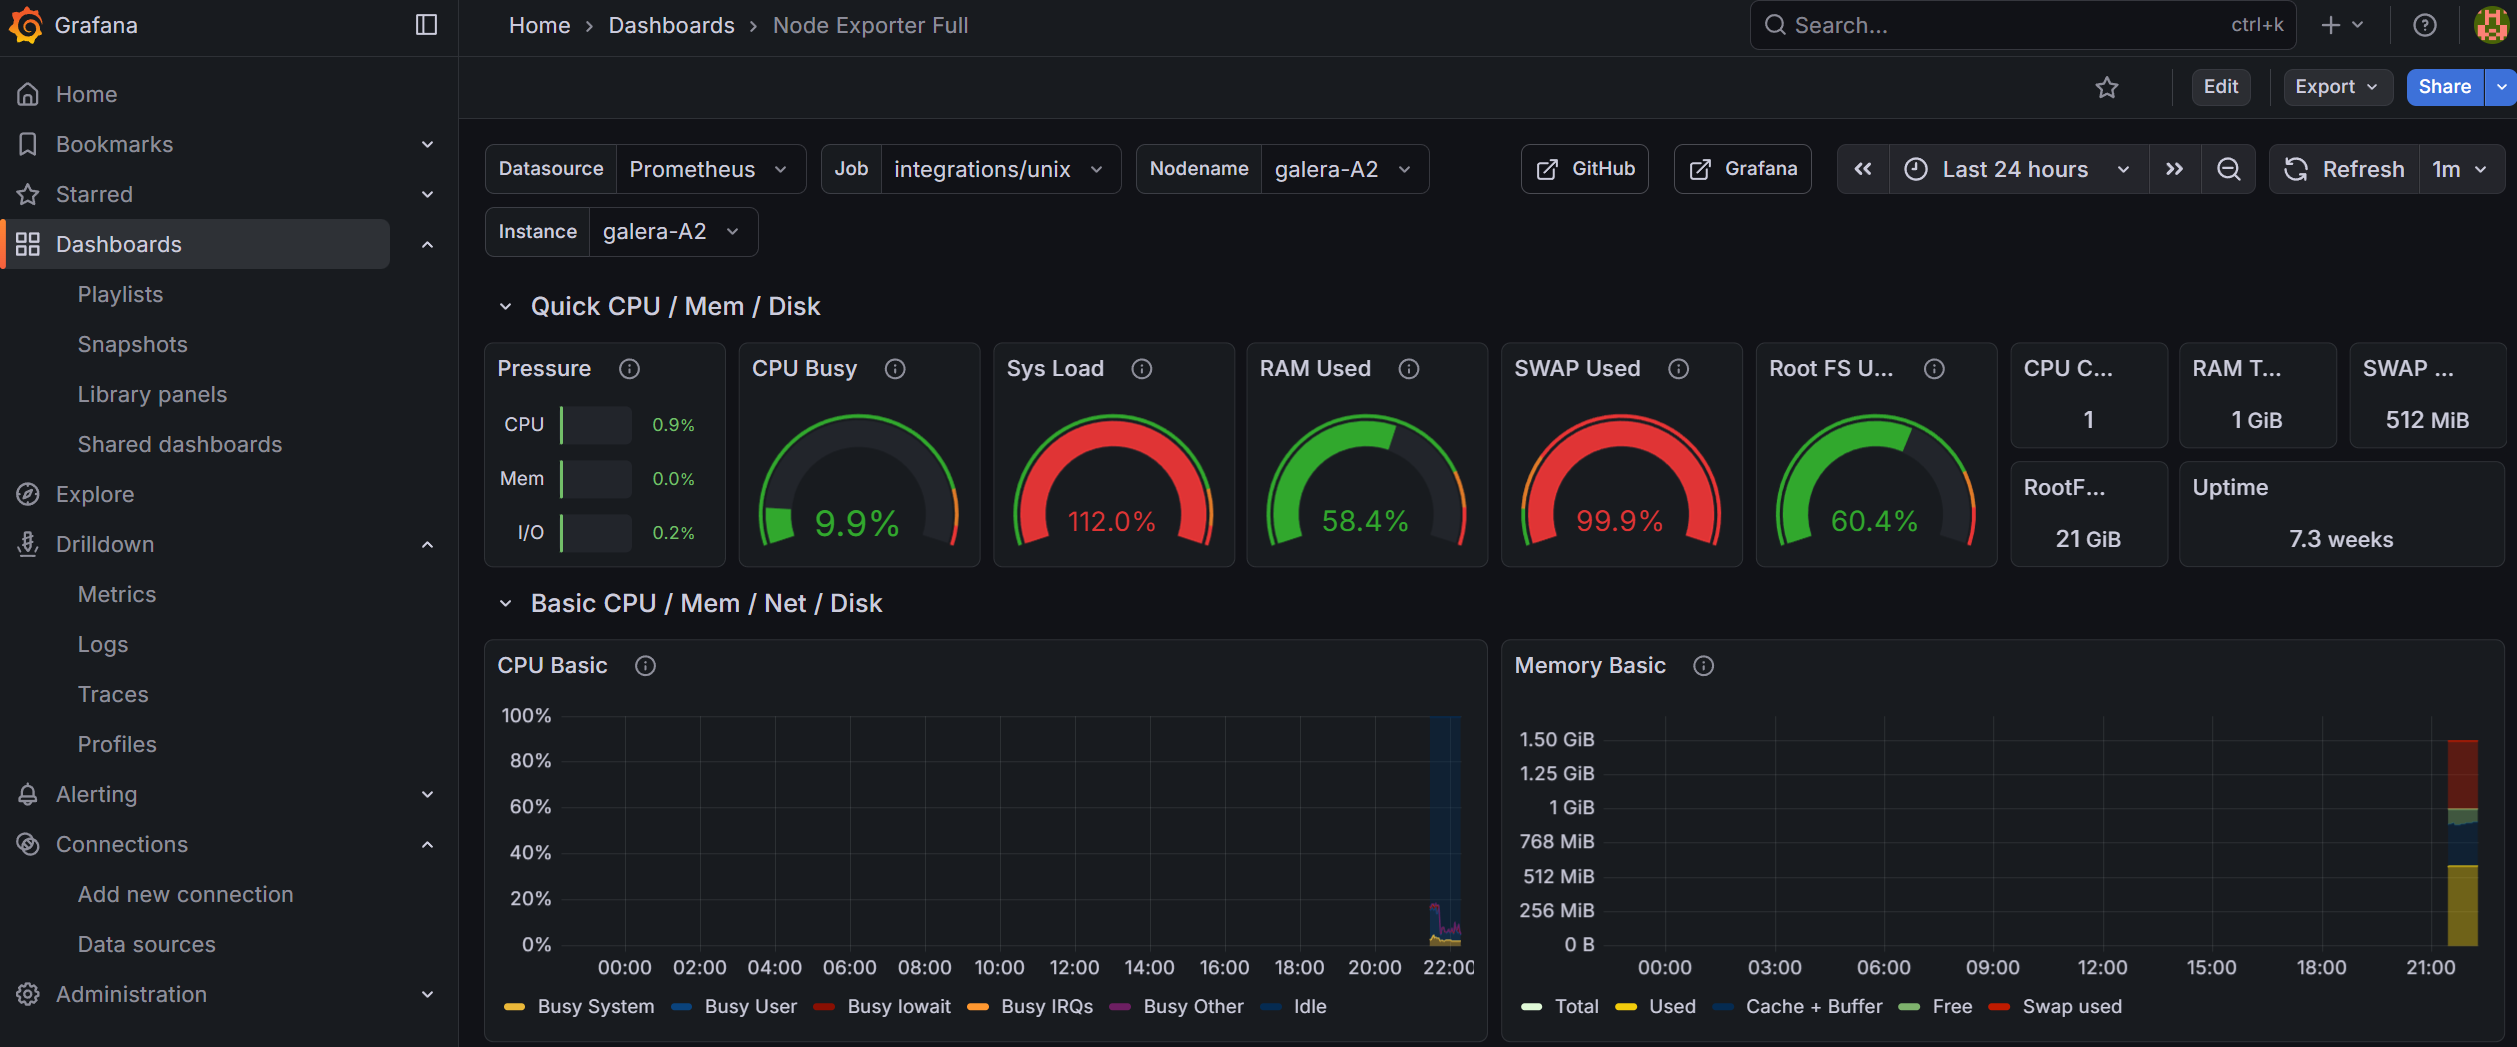
And what do I know? I can already see an issue with my galera-A2 node in terms of CPU and swap usage (I resolved that manually but boy, would it not be nice to have an automated solution? Hint hint for Part 2):
Add support for monitoring systemd
The Alloy configuration template already includes systemd service monitoring via the systemd collector. It tracks the status of key services defined in the unit_include regex filter (MariaDB, Nginx, Docker, SSH, etc.).
To verify it’s working, go to Explore → Prometheus and run:
node_systemd_unit_state{instance="your_hostname", state="active"}
You should see entries for each monitored service. The custom Infrastructure Overview dashboard (imported below) includes a “Services Status” panel that displays this data at a glance.
To add or remove monitored services, edit the unit_include regex in the config.alloy.j2 template and re-deploy via AWX.
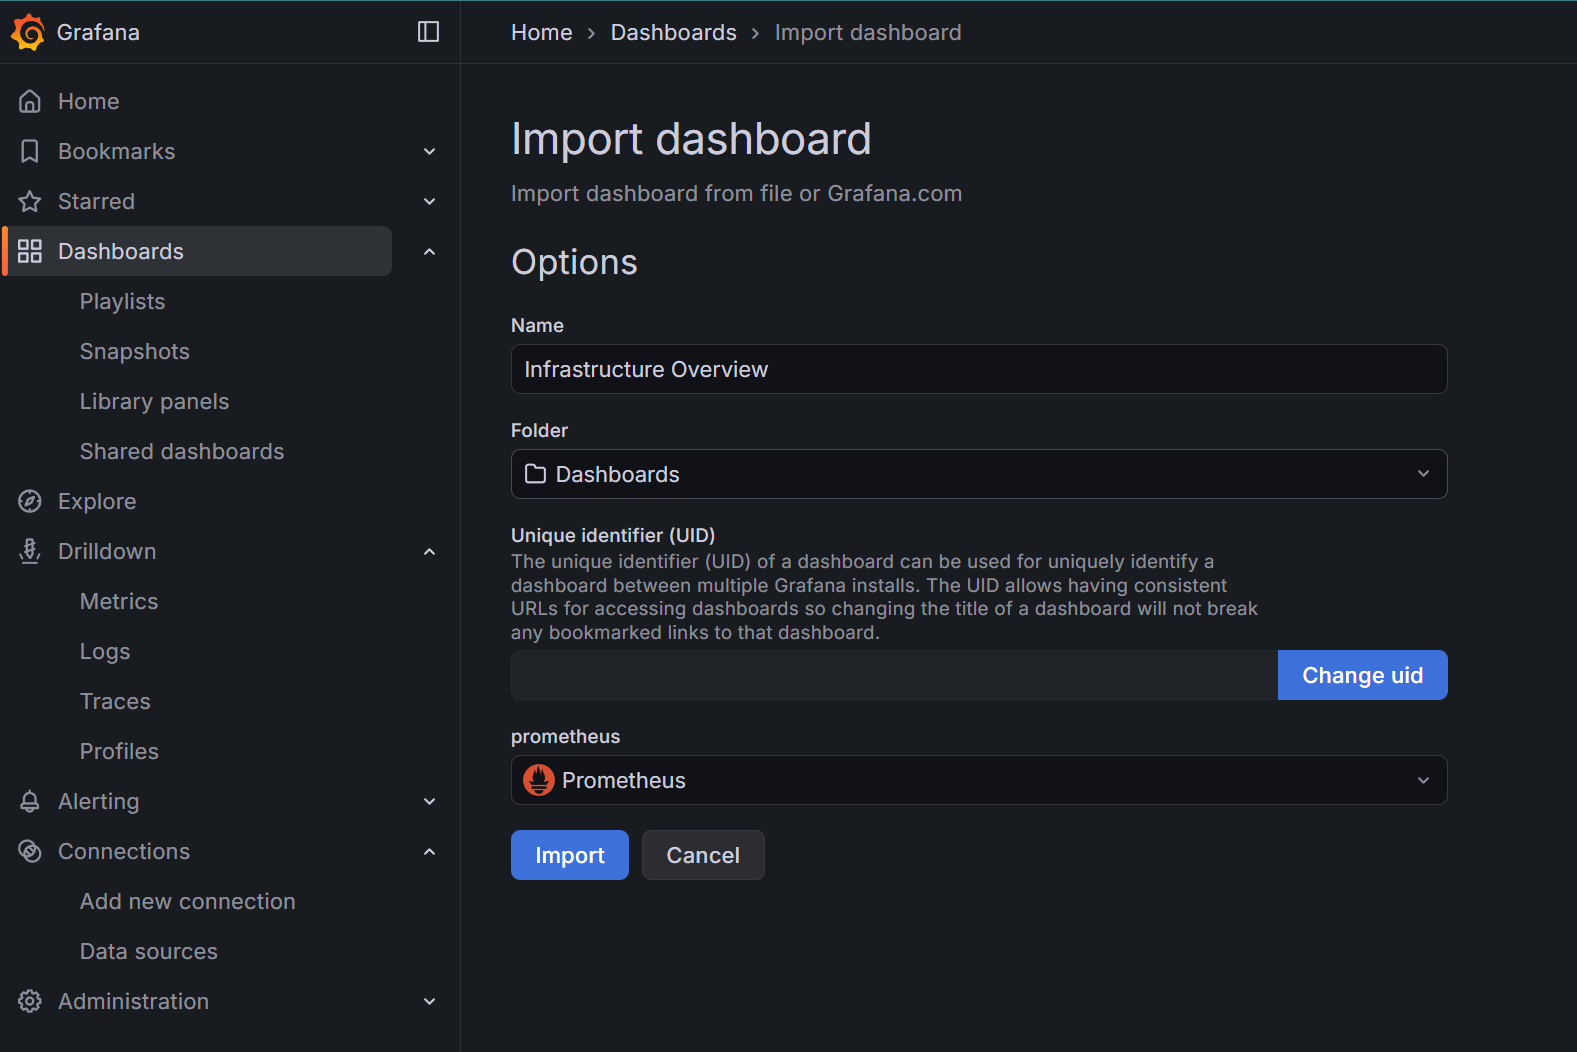
Import a custom dashboard
There is a whole plethora of dashboards that you can import from the internet. What I was missing slightly was a one-view overview of RAM, disk and service uptime status.
One custom dashboard that might be of interest is something that I drafted with Claude’s help (as it was getting quite complicated):
infrastructure-overview-dashboard-RAM+CPU+disk+systemd.json
Here’s what it looks like with RAM + disk + CPU + systemd (pre-defined services) monitoring:
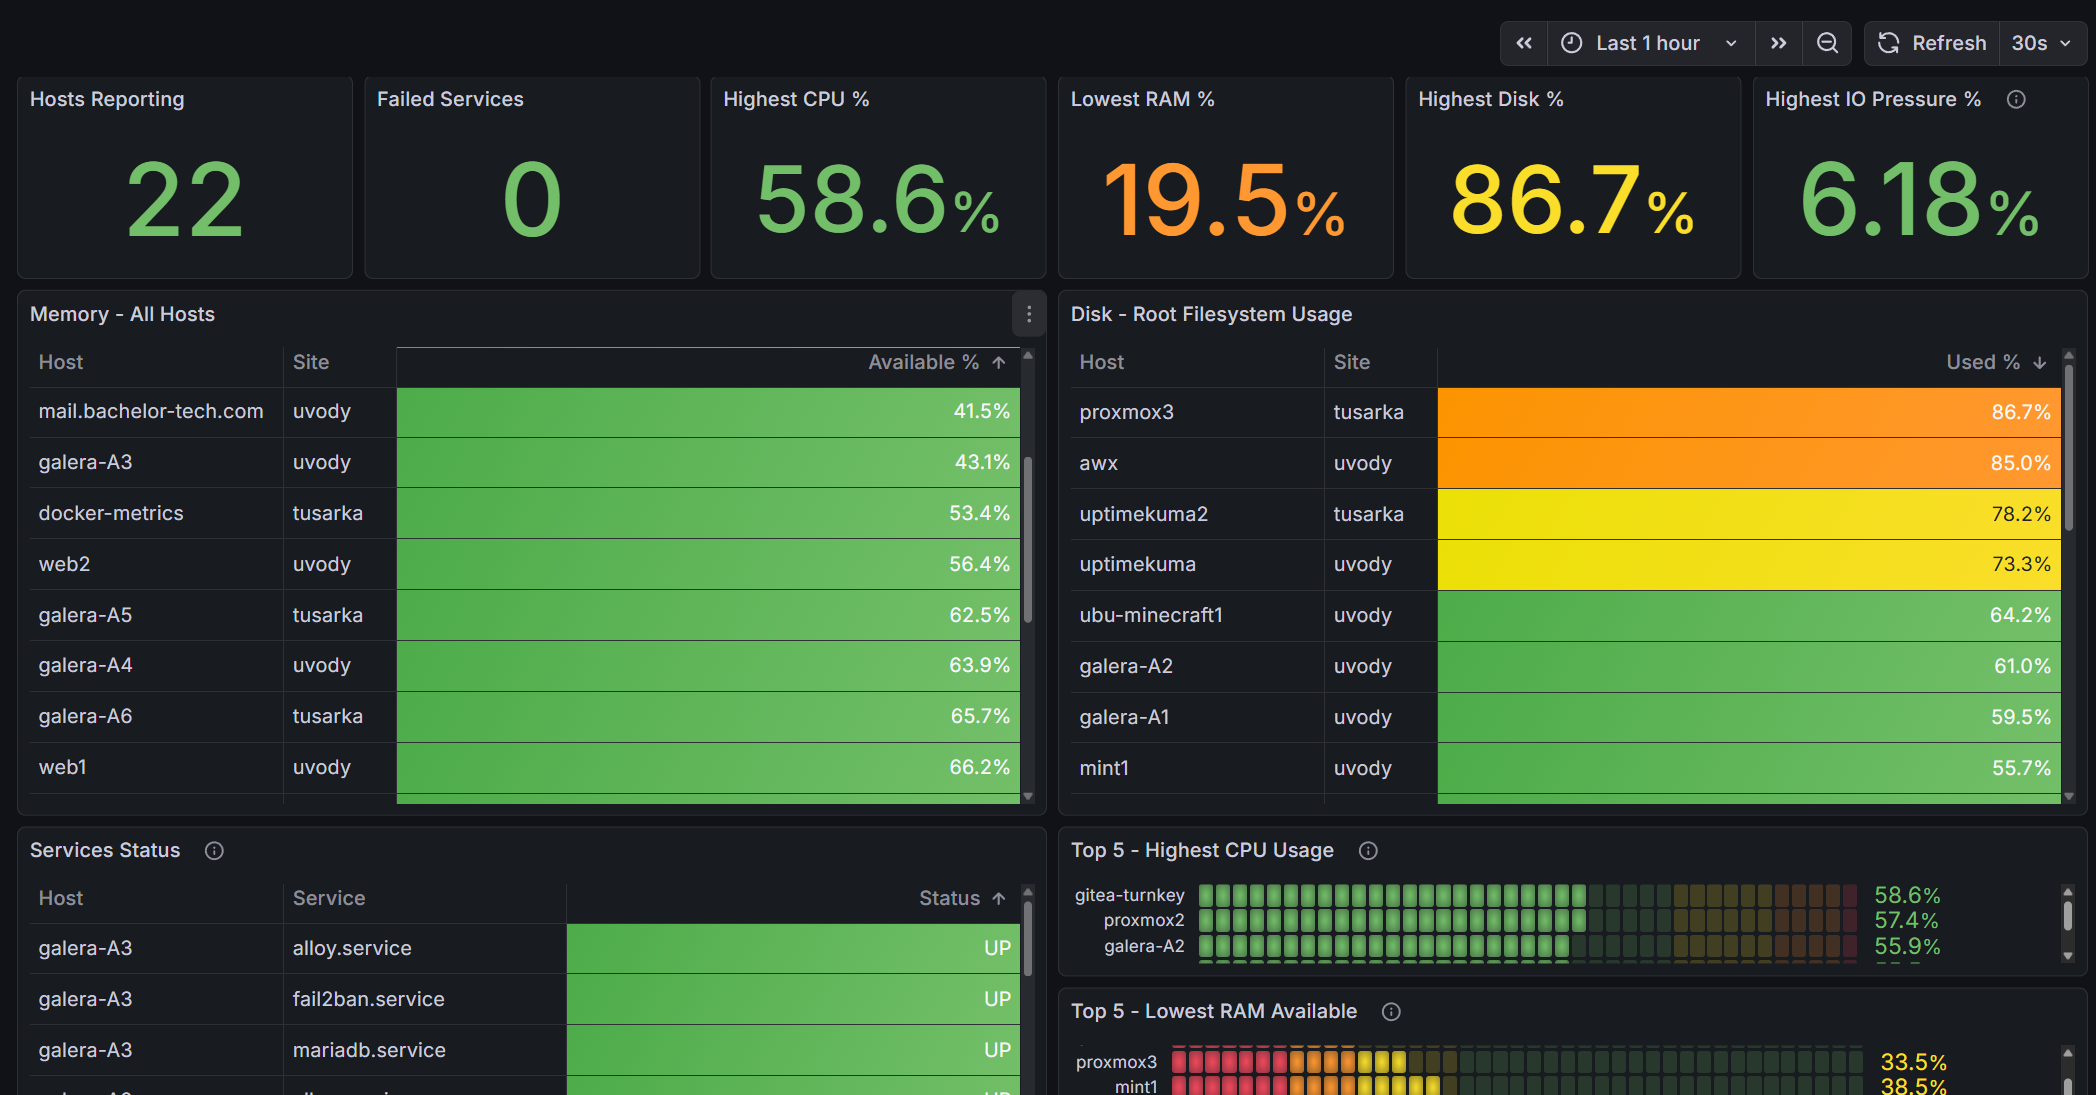
I personally prefer this custom developed overview much more, as it gives me a one-glance overview of everything I care about, including IO pressure and failing systemd services.
And there you have it! Logs are sorted. This is a cornerstone for Part 2 of this tutorial to demonstrate how you can pair it up with automated workflows in a self-hosted version of n8n that can be connected to AI (such as Claude) to deliver and summarize advice related to the findings from your metrics.
What is more, we can then even allow some level of independence to AI to implement a few recommended fixes based on the level of risk. Are you ready?