In one of the first steps in this tutorial, we allowed traffic for a network monitoring system. Yet up to this point, we have not set it up. It is important to be aware if one of your node clusters (or your Arbitrator) are down. In this case, I have included a few steps for UpTime Kuma. If you prefer Zabbix or another monitoring system, let me know in the comments and I may include it as well.
- Connect to one of your nodes in the cluster and add a user with sufficient privileges (in here we assume that your UpTime Kuma runs on the
192.168.8.xsubnet – change it to your own!):
mysql -u root -p

CREATE USER 'uptimekuma'@'192.168.8.0/24' IDENTIFIED BY 'your-secure-password';
GRANT PROCESS ON *.* TO 'uptimekuma'@'192.168.8.0/24';
FLUSH PRIVILEGES;
EXIT;
Why are we scripting it from Uptime Kuma? Isn’t there an easier way?
- Technically, we could just create a TCP monitor for each node and monitor that the MariaDB service is up this way. Yet if a node got out of sync, such a check would not really reveal it.
- You might also argue why not to use the ‘MySQL / MariaDB’ service monitor. The issue is that depending on your level of MariaDB, the driver layer in UpTimeKuma may have compatibility issues – in my testing, I have come across several combinations when it did not work. In addition, it will only work if you are using TLS, as at the time of writing this article, there is no way to tick a box to trust self-signed certs.
- So the script below covers two things – firstly it runs a TCP scan just like the built-in TCP scan would. And only if it passes, it will use the ‘mariadb-client’ package to connect to each node to check that it reports as in sync. This way, you will just have one monitor per node (and thus only one notification instead of multiple) and this notification will contain the required detail on what is not working.
- Connect to your UpTimeKuma instance via SSH and run the following commands:
sudo apt update
sudo apt install -y mariadb-client

nano /usr/local/bin/check_galera.sh

#!/bin/bash

# --- ARGUMENTS ---
# The Galera node IP to check is passed as the first argument
DB_HOST=$1
# The Uptime Kuma push code is passed as the second argument
KUMA_CODE=$2

# --- CONFIGURATION ---
# The base URL for your Uptime Kuma instance - change the IP to your own
UPTIME_KUMA_BASE_URL="<http://1.2.3.4:3001>"
DB_USER="uptimekuma"
DB_PASS="your-secure-password"
# ---------------------

if [ -z "$DB_HOST" ] || [ -z "$KUMA_CODE" ]; then
    echo "Usage: $0 <database_host_ip> <uptime_kuma_push_code>"
    exit 1
fi

# Construct the full push URL dynamically
UPTIME_KUMA_URL="${UPTIME_KUMA_BASE_URL}/api/push/${KUMA_CODE}"

# --- STEP 1: Check if the TCP port is open ---
if ! nc -z -w 3 "$DB_HOST" 3306 > /dev/null 2>&1; then
    # If nc fails, the port is down. Report and exit.
    curl -fsS --retry 3 "${UPTIME_KUMA_URL}?status=down&msg=Port_3306_Down&ping=" > /dev/null
    exit 0 # Exit cleanly since we successfully reported the status
fi

# --- STEP 2: If the port is open, proceed to check the Galera status ---
export MYSQL_PWD="$DB_PASS"
if mysql --skip-ssl -h "$DB_HOST" -u "$DB_USER" -e "SHOW STATUS LIKE 'wsrep_local_state_comment';" | grep -q "Synced"; then
    # If grep finds "Synced", the node is healthy. Push an UP status.
    curl -fsS --retry 3 "${UPTIME_KUMA_URL}?status=up&msg=Synced&ping=" > /dev/null
else
    # If grep does not find "Synced", the node is not healthy. Push a DOWN status.
    curl -fsS --retry 3 "${UPTIME_KUMA_URL}?status=down&msg=Not_Synced&ping=" > /dev/null
fi
unset MYSQL_PWD

# Save and exit and make the script executable
sudo chmod +x /usr/local/bin/check_galera.sh
- Then create a separate “Push” monitor in Uptime Kuma for each node to get a unique URL for each cron line.
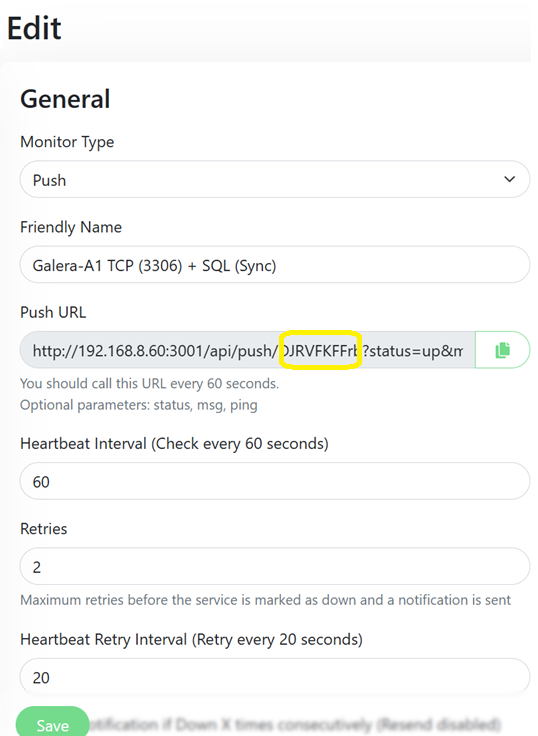
- And lastly, edit your crontab and re-use the same script to run for each node, passing its IP address and the unique push code.
# Edit crontab
sudo crontab -e

# Check Galera nodes every minute (replace your IP addresses with yours
# or use hostnames + add the respective Uptime Kuma passive push code
# from the generated URLs.
* * * * * /usr/local/bin/check_galera.sh 192.168.8.71 kuma_push_code1
* * * * * /usr/local/bin/check_galera.sh 192.168.8.72 kuma_push_code2
* * * * * /usr/local/bin/check_galera.sh 192.168.8.73 kuma_push_code3
* * * * * /usr/local/bin/check_galera.sh 192.168.8.74 kuma_push_code4
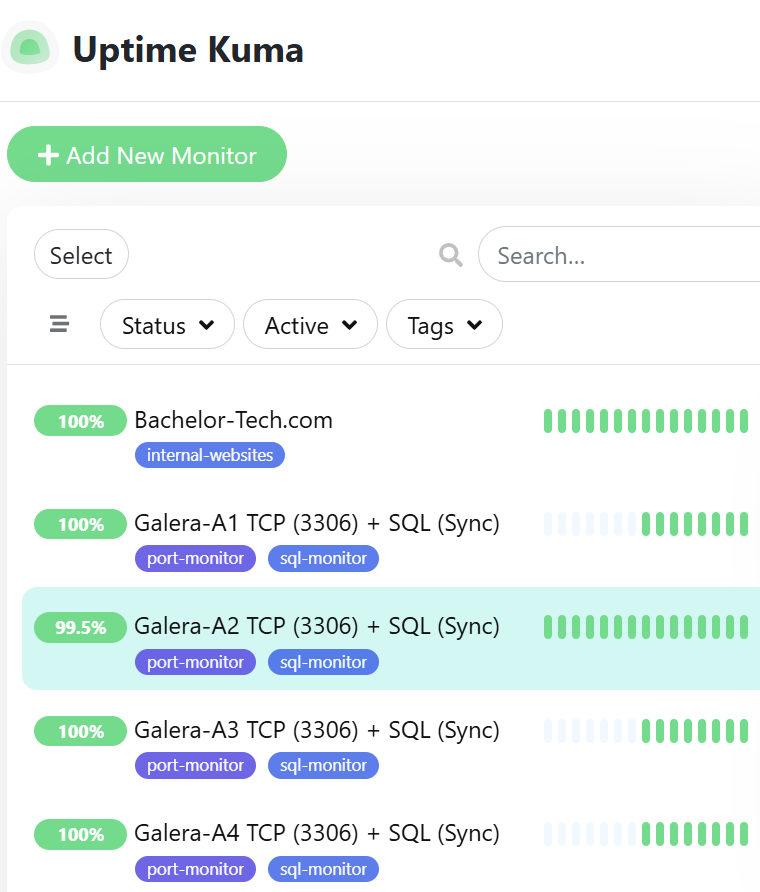
- The result in UpTimeKuma is as follows:
Test that the alerts work
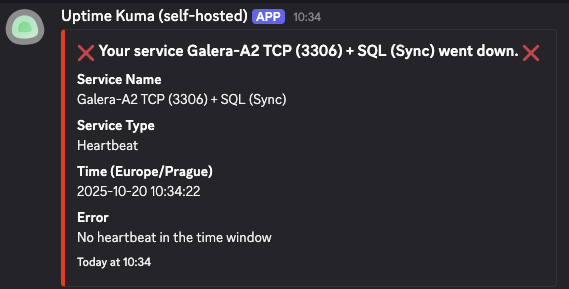
- Connect to one of your nodes and simulate a failure, such as by running sudo
systemctl stop mariadb. - When I disabled mariadb service on node2, here is the error specifying what went wrong:
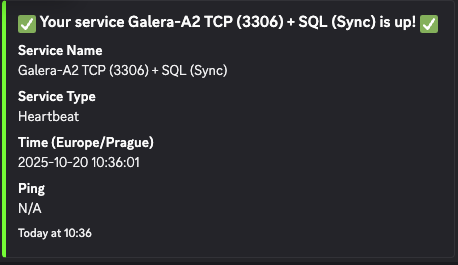
- When I switched it back on (by running
systemctl start mariadb), I got another notification:
- So now when we have a working cluster ideally with an Arbitor that is separate to the other physical servers & we have monitoring in place, it is time to start adding some data to our cluster and entrust it with data!