Until recently, to collect OS-level metrics as well as system logs, two agents were commonly used, such as node_exporter and promtail. However, promtail has recently entered long-term support with no active development (see their Github repo). Instead, they suggest to use Alloy.
- For those who have been using promtail and this change catches them by surprise, see more info on SUSE blog from December 2025.
- As explained on Github,
Alloyis an ‘open source OpenTelemetry Collector distribution with built-in Prometheus pipelines and support for metrics, logs, traces, and profiles’. Therefore, it collects both types of logs while still maintaining connectivity with existing Prometheus and Loki backends. - The one difference with Alloy is that it pushes data to Prometheus (rather than Prometheus pulling it), so a remote write receiver has to be enabled in the Docker (this was done already in the previous step).
Manually deploy on one host
Before we deploy it ‘en masse’ to all hosts, pick one of your choice and let’s test that the connection works. If it works, we will then transfer it into an Ansible playbook.
Note: Replace
YOUR_MONITORING_SERVER_IP,YOUR_HOSTNAME, andYOUR_SITEwith your actual values in the config below.
# Download the binary
cd /tmp
curl -LO <https://github.com/grafana/alloy/releases/download/v1.8.2/alloy-linux-amd64.zip>
unzip alloy-linux-amd64.zip

# Install Alloy
sudo mv alloy-linux-amd64 /usr/local/bin/alloy
sudo chmod +x /usr/local/bin/alloy

# Create config directory
sudo mkdir -p /etc/alloy

# Create config file
sudo tee /etc/alloy/config.alloy > /dev/null <<'EOF'
// ============================================
//     METRICS: System metrics collection
// ============================================

prometheus.exporter.unix "local" {
  enable_collectors = ["cpu", "diskstats", "filesystem", "loadavg", "meminfo", "netdev", "systemd", "pressure"]
  systemd {
    enable_restarts = true
    unit_include = "(mariadb|mysql|nginx|apache2|docker|sshd|alloy|proxmox-backup-proxy|pveproxy|pvedaemon|corosync|gitea|postfix|dovecot|fail2ban|syncthing@.*)\\\\.service"
  }
}

prometheus.exporter.process "default" {
  matcher {
    name    = "{{.Comm}}"
    cmdline = [".+"]
  }
}

discovery.relabel "unix" {
  targets = prometheus.exporter.unix.local.targets

  rule {
    target_label = "instance"
    replacement  = "YOUR_HOSTNAME"
  }
}

discovery.relabel "process" {
  targets = prometheus.exporter.process.default.targets

  rule {
    target_label = "instance"
    replacement  = "YOUR_HOSTNAME"
  }
}

prometheus.scrape "unix" {
  targets         = discovery.relabel.unix.output
  forward_to      = [prometheus.remote_write.default.receiver]
  scrape_interval = "30s"
  job_name        = "integrations/unix"
}

prometheus.scrape "process" {
  targets         = discovery.relabel.process.output
  forward_to      = [prometheus.remote_write.default.receiver]
  scrape_interval = "30s"
  job_name        = "integrations/process"
}

// ============================================
//     REMOTE WRITE: Push metrics to Prometheus
// ============================================

prometheus.remote_write "default" {
  endpoint {
    url = "http://YOUR_MONITORING_SERVER_IP:9090/api/v1/write"
  }
  external_labels = {
    host = "YOUR_HOSTNAME",
    site = "YOUR_SITE",
  }
}

// ============================================
//     LOGS: Systemd journal collection
// ============================================

loki.source.journal "systemd" {
  forward_to    = [loki.process.add_labels.receiver]
  relabel_rules = loki.relabel.journal.rules
  labels        = { job = "systemd-journal" }
}

loki.relabel "journal" {
  forward_to = []
  rule {
    source_labels = ["__journal__systemd_unit"]
    target_label  = "unit"
  }
  rule {
    source_labels = ["__journal_priority_keyword"]
    target_label  = "level"
  }
}

// ============================================
//     LOGS: File-based log collection
// ============================================

loki.source.file "varlogs" {
  targets    = [
    { __path__ = "/var/log/*.log", job = "varlogs" },
    { __path__ = "/var/log/**/*.log", job = "varlogs" },
  ]
  forward_to = [loki.process.add_labels.receiver]
}

// ============================================
//     LOGS: Label enrichment + push to Loki
// ============================================

loki.process "add_labels" {
  forward_to = [loki.write.default.receiver]
  stage.static_labels {
    values = {
      host     = "YOUR_HOSTNAME",
      instance = "YOUR_HOSTNAME",
      site     = "YOUR_SITE",
    }
  }
}

loki.write "default" {
  endpoint {
    url = "http://YOUR_MONITORING_SERVER_IP:3100/loki/api/v1/push"
  }
}
EOF

# Create systemd service
sudo tee /etc/systemd/system/alloy.service > /dev/null <<EOF
[Unit]
Description=Grafana Alloy
After=network.target

[Service]
Type=simple
ExecStart=/usr/local/bin/alloy run /etc/alloy/config.alloy --storage.path=/var/lib/alloy
Restart=always
RestartSec=5

[Install]
WantedBy=multi-user.target
EOF

# Create storage directory
sudo mkdir -p /var/lib/alloy

# Start it
sudo systemctl daemon-reload
sudo systemctl enable --now alloy

# Verify
sudo systemctl status alloy
Watch the logs to see if there are any errors (see the troubleshooting section below if you find any).
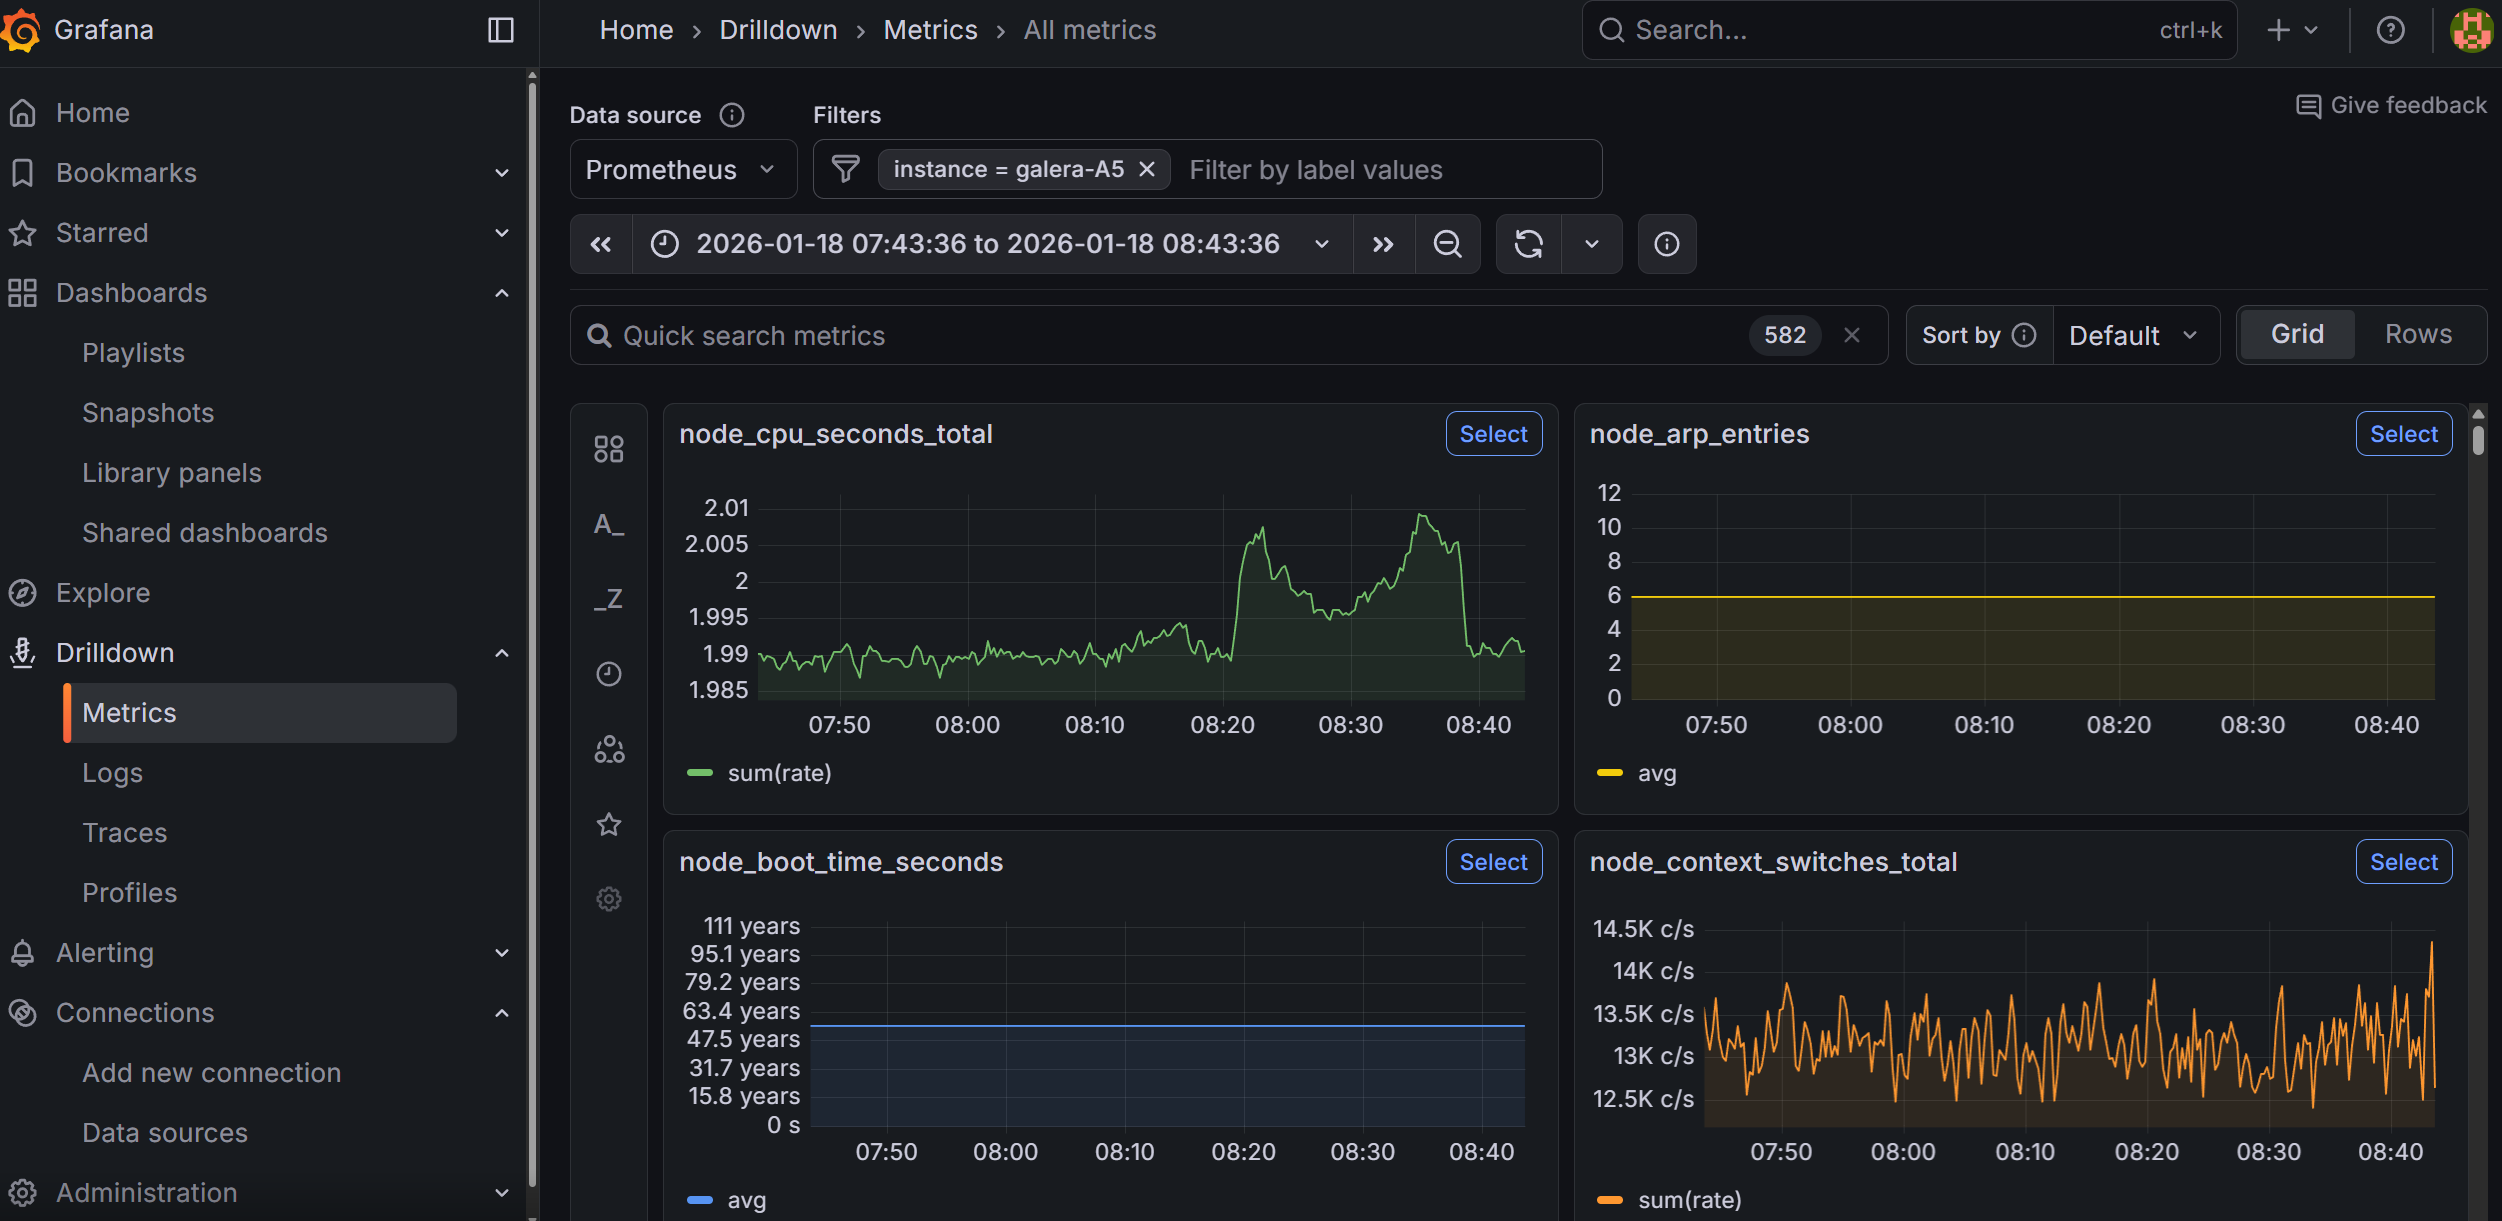
If all goes well, you will be able to go to Grafana under Drilldown → Metrics, and manually type instance (press enter), followed by selecting the = (equal sign) and then type your hostname. This will show graphs related to the host that you have installed the Alloy agent on.
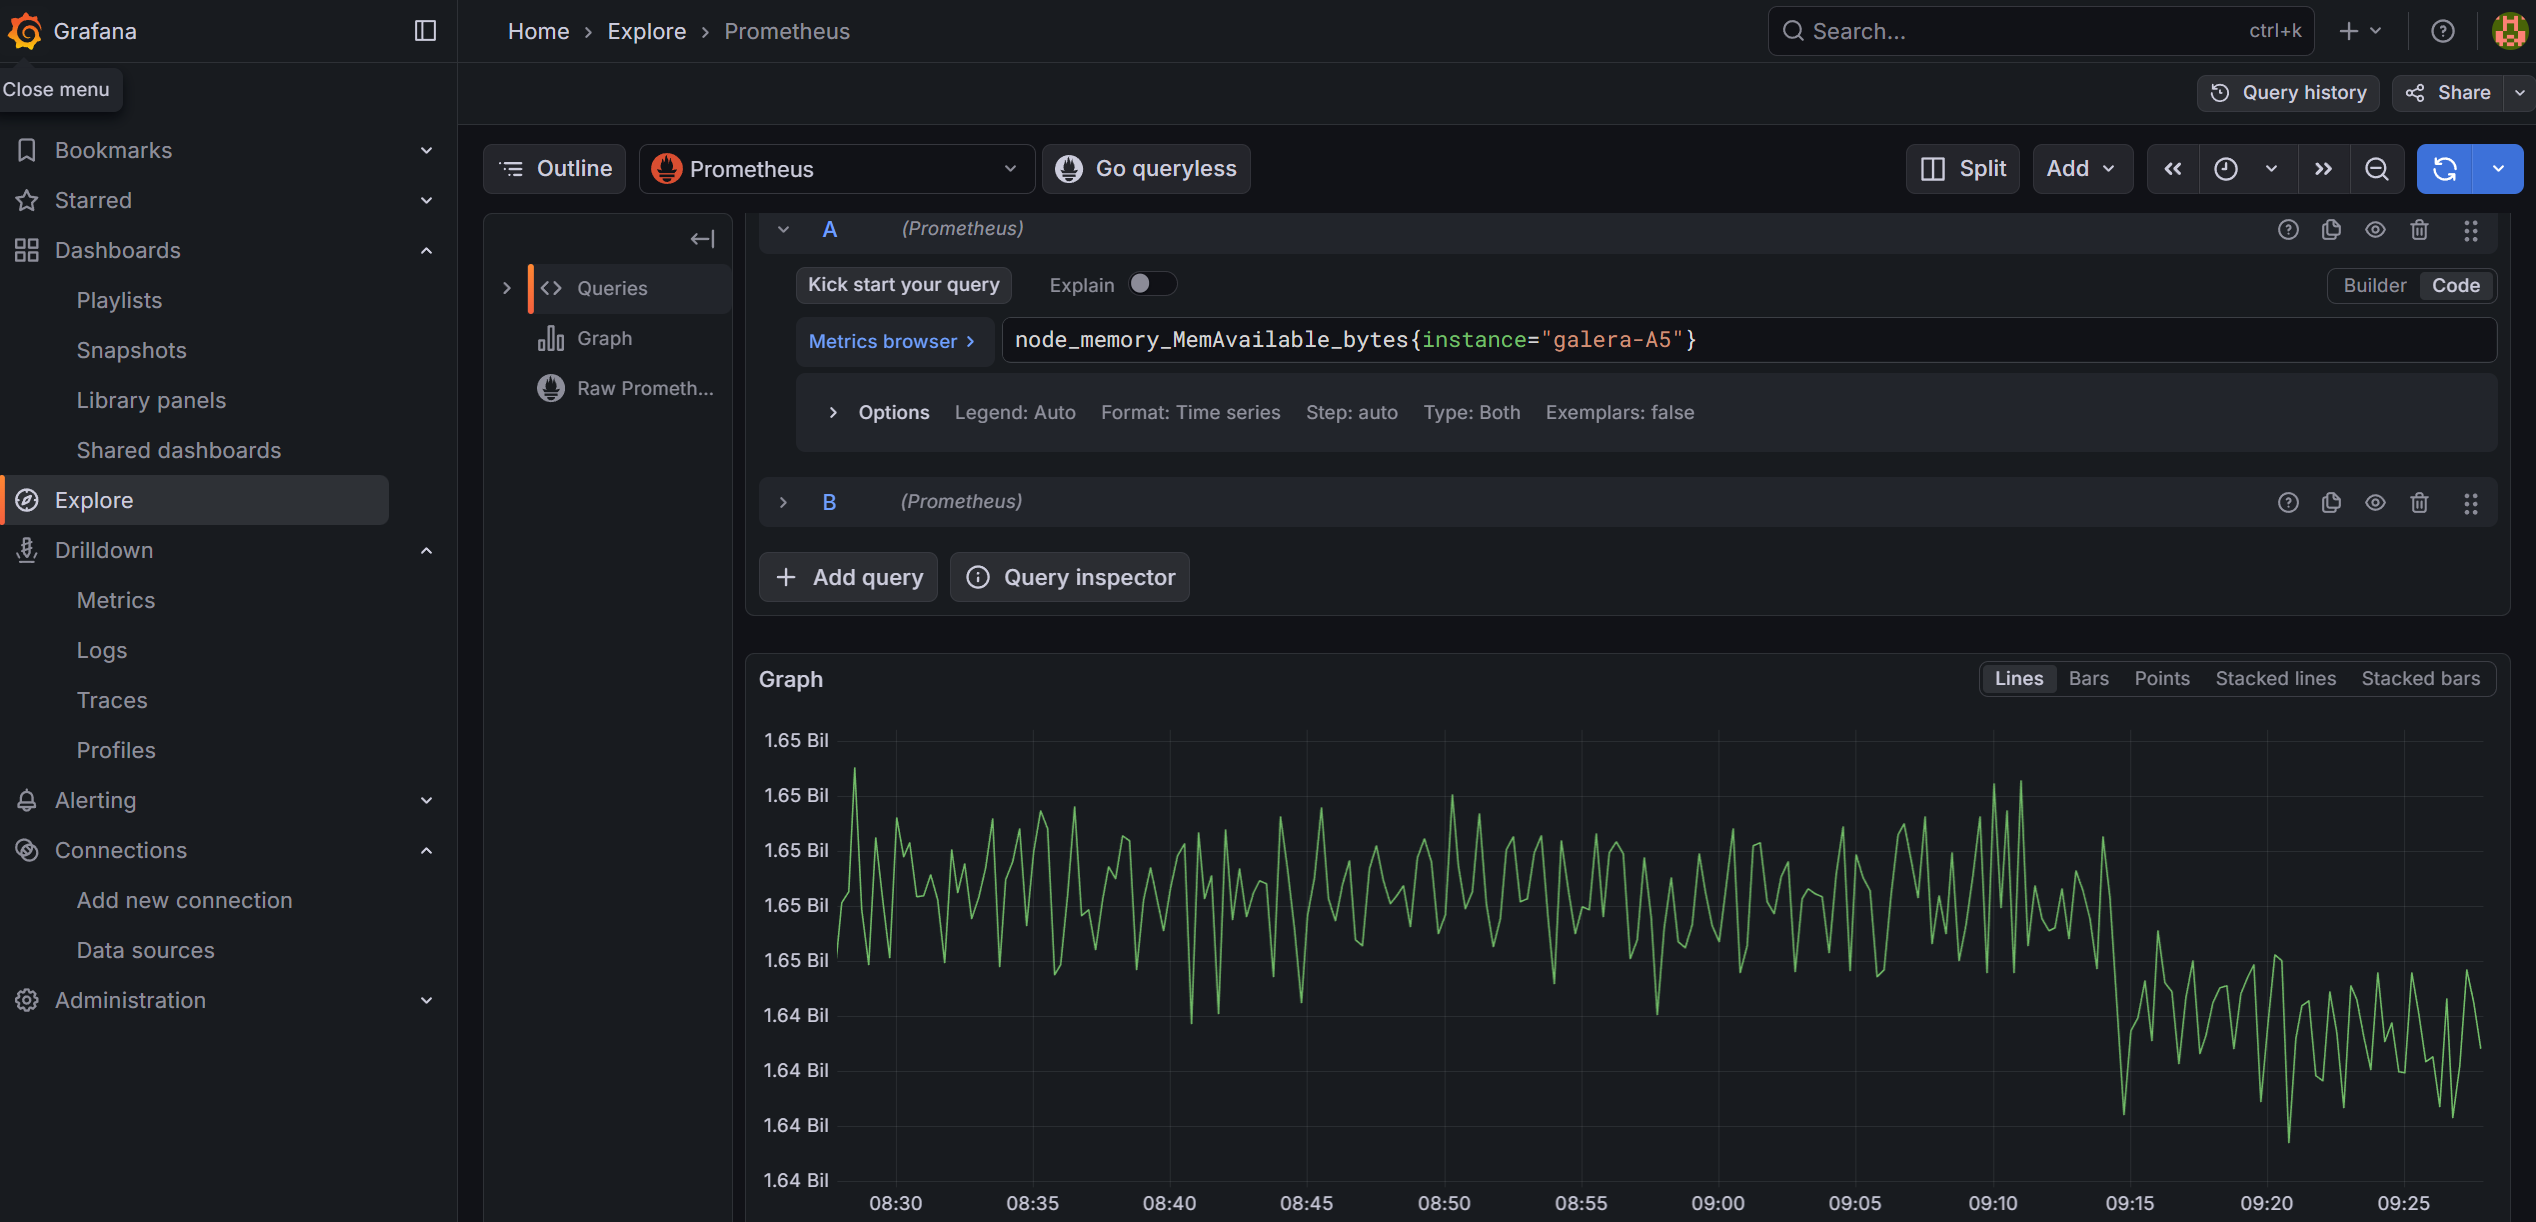
Alternatively, you can also go to ‘Explore’ and build your query there from the available options. For example, you can look at available RAM for your host using the node_memory_MemAvailable_bytes parameter. If you prefer to store and copy paste your queries, you can click on the ‘Code’ button (instead of using the ‘Builder’ and enter the full query) and then click on the blue button to run the query:
# Memory available on your host
node_memory_MemAvailable_bytes{instance="your_hostname"}
# CPU usage (all cores)
node_cpu_seconds_total{instance="your_hostname"}
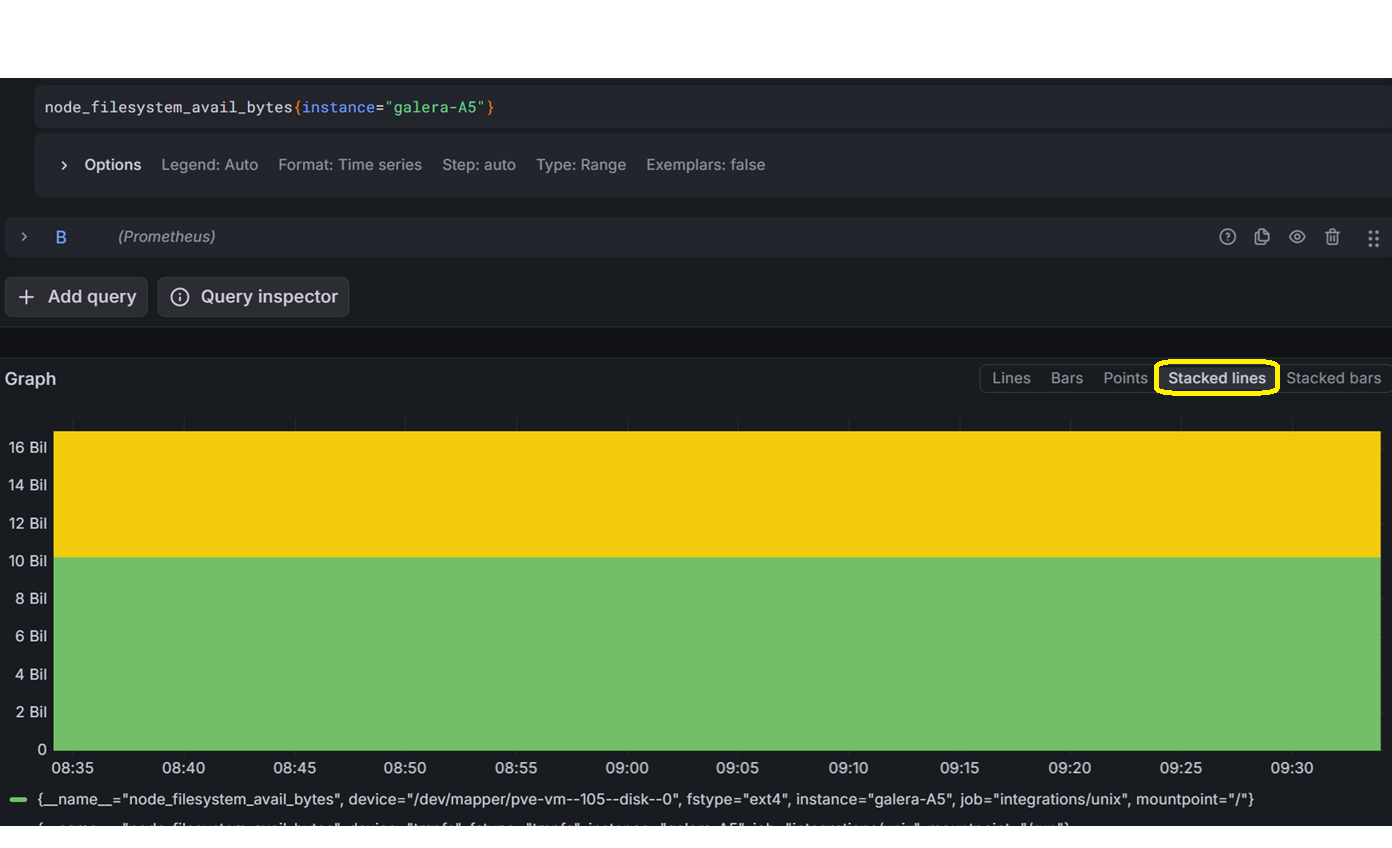
# Disk space free
node_filesystem_avail_bytes{instance="your_hostname"}
# All metrics from your host
{instance="your_hostname"}
For queries such as those related to drive space available versus used, you can change the graph style to ‘Stacked lines’. I recommend you to play around in Grafana for a while.
Troubleshooting connectivity with Alloy
Issue 1: Alloy service not starting or reporting errors
Check the logs first:
sudo journalctl -u alloy -f --no-pager
Common causes:
- Config syntax errors: Alloy’s River syntax is strict. Run a syntax check:
/usr/local/bin/alloy fmt /etc/alloy/config.alloyIf it reformats without errors, the syntax is valid. - Permission denied: Alloy needs read access to
/var/log/files and the systemd journal. If running as a non-root user, ensure it has thesystemd-journalandadmgroups:sudo usermod -aG systemd-journal alloy sudo usermod -aG adm alloy - Port already in use: Alloy’s default HTTP debug UI runs on port 12345. If another service uses it, add
-server.http.listen-addr=0.0.0.0:12346to the ExecStart line in the systemd unit file. - Storage path doesn’t exist: Ensure
/var/lib/alloyexists and is writable.
Issue 2: Nothing appearing in Grafana
Explore Prometheus without Grafana. In the query box, try the following commands to see if it sees the host data:
# Any Unix-based hosts
{job="integrations/unix"}

# Summary of available memory for Unix hosts:
node_memory_MemAvailable_bytes{job="integrations/unix"}

# CPU info for a specific host:
node_cpu_seconds_total{instance="your_host"}
Issue 3: No data flowing to Loki
Check if logs are arriving. From the Docker host, run the following:
curl -s "http://your_docker_host_ip:3100/loki/api/v1/labels"
If you see labels like host, job, unit, then logs are arriving. If empty, check:
- Alloy logs for Loki push errors
- Firewall rules between the host and the monitoring server on port 3100
Issue 4: Alloy is running but Prometheus shows no data
Verify the remote write endpoint is reachable from the host:
curl -s -o /dev/null -w "%{http_code}" http://your_monitoring_server:9090/api/v1/write
A 204 response means the endpoint is accepting writes. A connection timeout means a firewall or routing issue.
Issue 5: Firewall blocking connections
If using OPNSense, ensure you have firewall rules allowing traffic from your monitored hosts to the monitoring server on ports 9090 (Prometheus), 3100 (Loki), and 3000 (Grafana).
Issue 6: Labels are missing or incorrect in Grafana
If instance, site, or host labels aren’t appearing, add them. Then restart the agent by running:
sudo systemctl restart alloy
Check the Alloy config on the affected host:
cat /etc/alloy/config.alloy
Verify the external_labels block in prometheus.remote_write and the stage.static_labels block in loki.process