Create your Docker compose file for the required containers:
nano /opt/monitoring/docker-compose.yml
services:
  prometheus:
    image: prom/prometheus:latest
    container_name: prometheus
    restart: unless-stopped
    ports:
      - "9090:9090"
    volumes:
      - /opt/monitoring/config/prometheus.yml:/etc/prometheus/prometheus.yml:ro
      - /opt/monitoring/data/prometheus:/prometheus
    command:
      - '--config.file=/etc/prometheus/prometheus.yml'
      - '--storage.tsdb.path=/prometheus'
      - '--storage.tsdb.retention.time=30d'
      - '--web.enable-lifecycle'
      - '--web.enable-remote-write-receiver' # Required for Alloy to work
    networks:
      - monitoring

  loki:
    image: grafana/loki:latest
    container_name: loki
    restart: unless-stopped
    ports:
      - "3100:3100"
    volumes:
      - /opt/monitoring/config/loki.yml:/etc/loki/local-config.yaml:ro
      - /opt/monitoring/data/loki:/loki
    command: -config.file=/etc/loki/local-config.yaml
    networks:
      - monitoring

  grafana:
    image: grafana/grafana:latest
    container_name: grafana
    restart: unless-stopped
    ports:
      - "3000:3000"
    volumes:
      - /opt/monitoring/data/grafana:/var/lib/grafana
      - /opt/monitoring/config/grafana/provisioning:/etc/grafana/provisioning:ro
    environment:
      - GF_SECURITY_ADMIN_PASSWORD=changeme
      - GF_SERVER_ROOT_URL=https://grafana.bachelor-tech.com
      - GF_USERS_ALLOW_SIGN_UP=false
    networks:
      - monitoring
    depends_on:
      - prometheus
      - loki

networks:
  monitoring:
    driver: bridge
⚠️ Security note: By default, Prometheus, Loki, and Grafana run without authentication (aside from Grafana’s admin password). If your monitoring server is accessible from untrusted networks, consider placing these services behind a reverse proxy with authentication, or binding them to localhost only and accessing via SSH tunnel. If you struggle to do that, reach out to me via the comments section.
Prometheus config
Now we can create the config for these containers. You can add some of your hosts manually to test the agent deployment later. We will handle their addition through AWX afterward.
nano /opt/monitoring/config/prometheus.yml
global:
  scrape_interval: 15s
  evaluation_interval: 15s

scrape_configs:
  # Prometheus monitors itself
  - job_name: 'prometheus'
    static_configs:
      - targets: ['localhost:9090']

  # Node exporters - we'll populate this as we deploy them
  # For now, just a placeholder structure
  - job_name: 'node'
    static_configs:
      # Site 1
      - targets:
          - '192.168.16.76:9100'   # A test host
        labels:
          site: 'site1'
Loki configuration
Similarly, let’s create a config file for Loki:
nano /opt/monitoring/config/loki.yml
auth_enabled: false

server:
  http_listen_port: 3100
  grpc_listen_port: 9096

common:
  instance_addr: 127.0.0.1
  path_prefix: /loki
  storage:
    filesystem:
      chunks_directory: /loki/chunks
      rules_directory: /loki/rules
  replication_factor: 1
  ring:
    kvstore:
      store: inmemory

query_range:
  results_cache:
    cache:
      embedded_cache:
        enabled: true
        max_size_mb: 100

schema_config:
  configs:
    - from: 2020-10-24
      store: tsdb
      object_store: filesystem
      schema: v13
      index:
        prefix: index_
        period: 24h

ruler:
  alertmanager_url: <http://localhost:9093>

limits_config:
  retention_period: 30d
Grafana provisioning
Create Grafana provisioning for data sources.
mkdir -p /opt/monitoring/config/grafana/provisioning/datasources
nano /opt/monitoring/config/grafana/provisioning/datasources/datasources.yml
apiVersion: 1

datasources:
  - name: Prometheus
    type: prometheus
    access: proxy
    url: <http://prometheus:9090>
    isDefault: true
    editable: false

  - name: Loki
    type: loki
    access: proxy
    url: <http://loki:3100>
    editable: false
Fix permissions for containers:
sudo chown -R 472:472 /opt/monitoring/data/grafana
sudo chown -R 65534:65534 /opt/monitoring/data/prometheus
sudo chown -R 10001:10001 /opt/monitoring/data/loki
Start it:
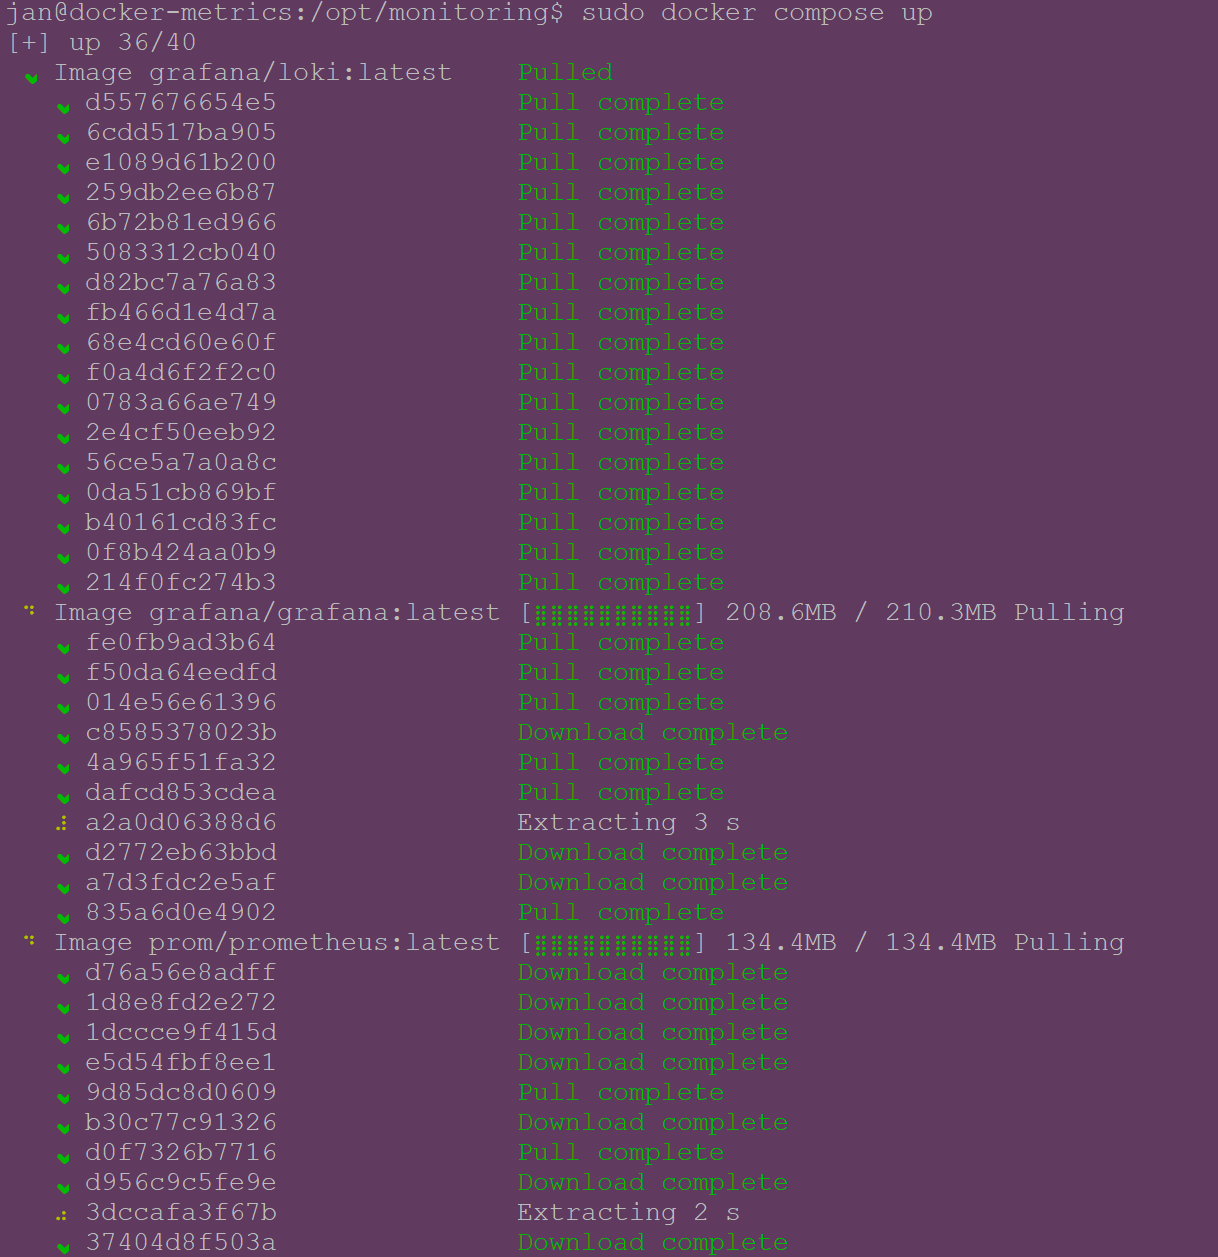
cd /opt/monitoring
sudo docker compose up -d
When launching it for the first time, the Docker images will be downloaded. Note: sudo is not needed for docker commands since your user was added to the docker group earlier. However, you must log out and back in first for the group change to take effect.
Verify that the containers are running and if they report any errors:
docker compose ps
docker compose logs -f
Increase Loki rate limits
Loki’s default ingestion rate limits (4MB/s) can be too restrictive once you have many hosts reporting. Increase them to accommodate the volume of data from your fleet — without this, you may see rate-limiting errors once all agents are reporting:
nano /opt/monitoring/config/loki.yml

# Add these at the end of the file in 'limits_config:' section.
  ingestion_rate_mb: 16
  ingestion_burst_size_mb: 32
  per_stream_rate_limit: 5MB
  per_stream_rate_limit_burst: 15MB
Restart Loki to apply the changes:
docker compose restart loki
Test that you can reach the Web UIs:
- Grafana:
http://your-vm-ip:3000(admin / changeme) - Prometheus:
http://your-vm-ip:9090 - Loki:
http://your-vm-ip:3100/ready
Add your host into static mapping (Unbound DNS)
Assign a static IP to your host on your DHCP server. If on OPNSense, you can do so under Services → Kea DHCPv4 → Reservations.
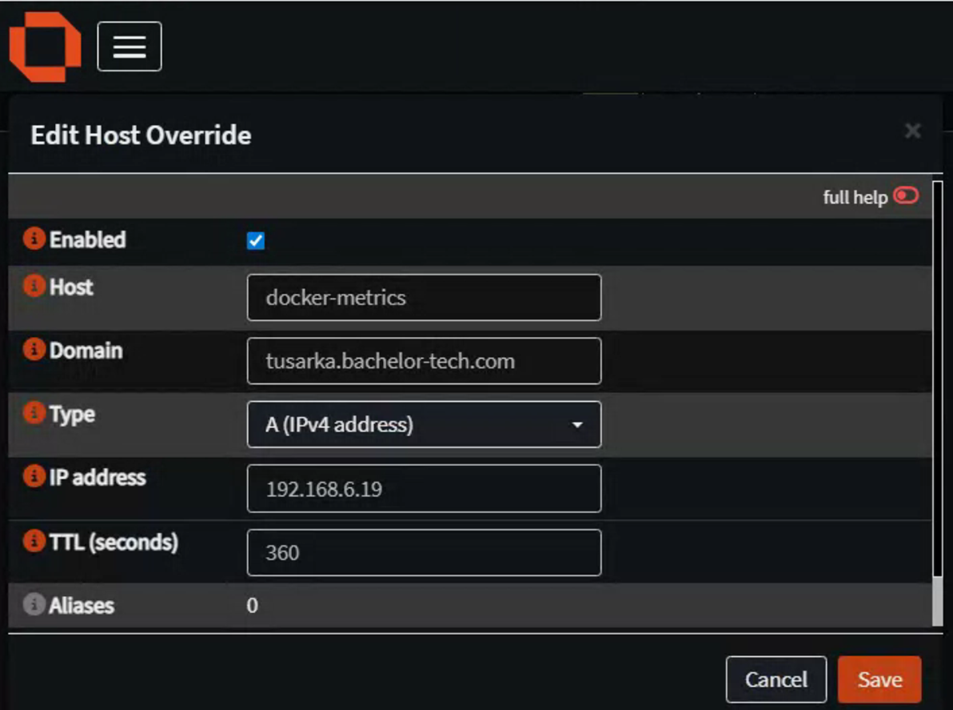
As Unbound DNS, go to Services → Unbound DNS → Overrides and add a new host:
- Host:
your_chosen_hostname - Domain:
yourdomain.tld - Type:
IPv4 - IP Address: your host’s local IP address
Firewall considerations
If you’re using OPNSense or another firewall across sites or subnets, ensure you have rules allowing traffic from your monitored hosts to the monitoring server on:
- Port 9090 — Prometheus remote write endpoint
- Port 3100 — Loki log push endpoint
- Port 3000 — Grafana web UI (if accessed remotely)
In the next step, we will set up an agent on one host to test connectivity and then create an AWX playbook to deploy this agent to all hosts.