If you’re managing more than a handful of servers, you already know the feeling: something breaks at 2 AM, and you’re SSH-ing into machines one by one trying to figure out which host ran out of disk space or which service silently crashed three hours ago.
This tutorial addresses that. By the end of Part 1, you’ll have a single dashboard showing CPU, RAM, disk usage and service health across every host in your infrastructure — whether that is 3 machines or 30.
We’re deploying three services using Docker in a Proxmox VM (though any Debian host will work):
- Prometheus — collects resource metrics (CPU, RAM, disk, network) from all your hosts via the Grafana Alloy agent
- Loki — collects and indexes logs from every server’s systemd journal and log files
- Grafana — visualizes everything in dashboards you can actually glance at and understand
We’ll also use AWX (Ansible’s web UI) to push the monitoring agent to your entire fleet in one click – you can use another automation platform of your choice, such as Semaphore UI.
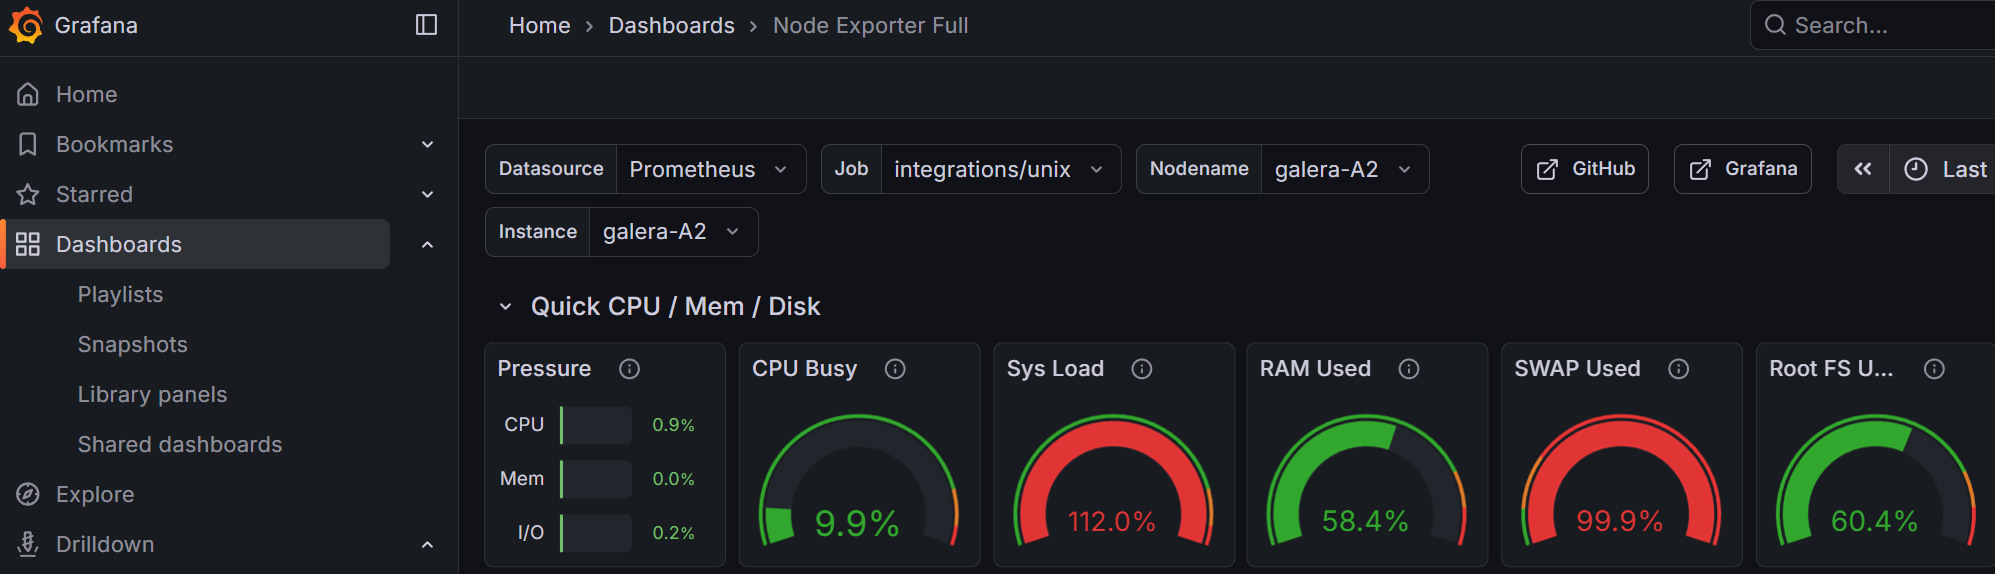
What does the end result look like?
A single pane of glass where you can see, at a glance:
- Which hosts are healthy and which need attention
- RAM, CPU, and disk usage ranked by severity
- Service uptime status (MariaDB, Nginx, Docker, SSH, etc.)
- Full searchable logs from every host
What’s in Part 2?
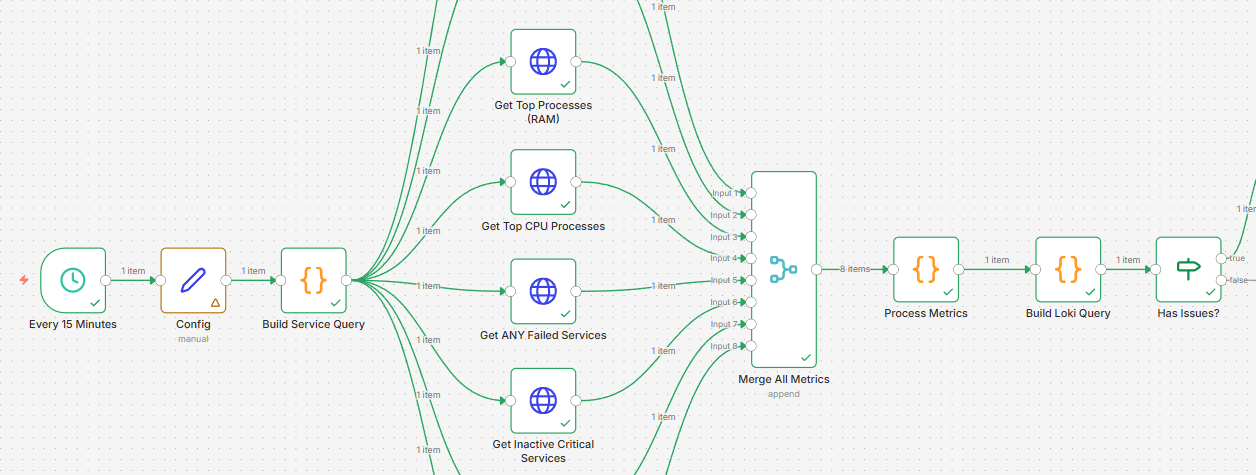
In the follow-up, we connect this monitoring stack to n8n and AI — so that when something goes wrong, you don’t just get an alert, you get a diagnosis and recommended fix. We even let AI implement low-risk remediations automatically. But first, let’s get the data flowing.