Part 2: Automate Infrastructure Monitoring from Prometheus & Loki with AI-powered n8n workflows with AWX or Semaphore UI (Ansible)
Go to previous section Download Markdown
February 5, 2025
Table of Contents
Introduction
Would you like to empower AI with certain maintenance tasks over your infrastructure with an approval workflow via Discord to stay in control? How to best define a low, medium or high-risk operation and modify AI’s behavior accordingly to avoid unwanted surprises? In this tutorial, we will build on Part 1 of the tutorial and dive in while leveraging the following technologies:
- Prometheus (covered in Part 1) - captures metrics - you will need to install it with the
process-exporter(namedprocess-exporter) module to fetch all the required details. - Loki (covered in Part 1) - captures logs
- Grafana (covered in Part 1) - visualizes data (not required for AI-powered automation)
- n8n (covered in this Part 2) - automation platform (low-code).
- Claude AI (or another LLM of your preference)
- AWX or Semaphore UI (you can also use another tool like Ansible Automation Platform (AAP, which replaced Ansible Tower), Spacelift, Rundeck, etc.)
- If you do not have it set up yet, follow my previous tutorial on how to Deploy Ansible AWX to automate OS patching .
- Steps 1 and 2 in this tutorial can be completed without it.
- Gitea (or another source version control tool) to store your Ansible playbooks (same as with AWX).
As the first step, we will deploy n8n and connect it with AI (Claude) to analyze logs from our monitoring tools regularly to provide us with consolidated advice about service outages and to suggest tweaks based on metrics (RAM / disk / CPU usage).
1. Deploy n8n in Docker
You can use the same VM as for Prometheus, Loki and Grafana to deploy n8n in Docker:
# Create directory and a docker-compose file
sudo mkdir -p /opt/n8n
cd /opt/n8n
sudo nano docker-compose.yml
services:
n8n:
image: docker.n8n.io/n8nio/n8n:latest
container_name: n8n
restart: unless-stopped
ports:
- "5678:5678"
environment:
- GENERIC_TIMEZONE=Europe/Prague
- TZ=Europe/Prague # Change it according to yours
- N8N_HOST=n8n.yourdomain.priv
- N8N_PORT=5678
- N8N_PROTOCOL=http
- WEBHOOK_URL=http://n8n.yourdomain.priv:5678/
- N8N_SECURE_COOKIE=false
- NODE_ENV=production
# Allow selected built-in Node modules (fs, path)
- NODE_FUNCTION_ALLOW_BUILTIN=fs,path
# Database - using SQLite for simplicity, can upgrade to PostgreSQL later
- DB_TYPE=sqlite
volumes:
- n8n_data:/home/node/.n8n
- ./local-files:/files
networks:
- n8n-network
healthcheck:
test: ["CMD-SHELL", "wget -q --spider http://localhost:5678/healthz || exit 1"]
interval: 30s
timeout: 10s
retries: 3
start_period: 30s
volumes:
n8n_data:
name: n8n_data
networks:
n8n-network:
name: n8n-network# Create local-files directory with correct permissions
sudo mkdir -p local-files
sudo chown -R 1000:1000 local-files
# Deploy
docker compose pull
docker compose up -d
# Check status
docker compose logs -f- Try accessing it on the website:
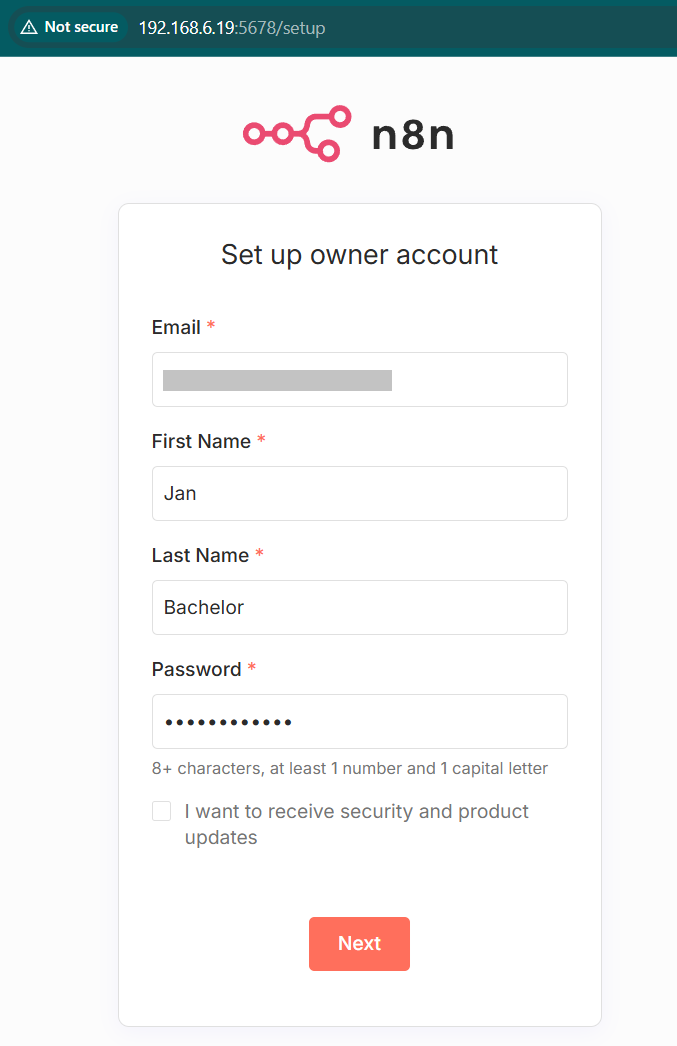
- Complete your registration to receive a free license key (indicate that you are not using n8n for work purposes).
Connect n8n with Claude
- Head to https://platform.claude.com/dashboard , log in and if you do not have it already, purchase a credit for $5. Don’t worry, it will last us for quite a while 😇
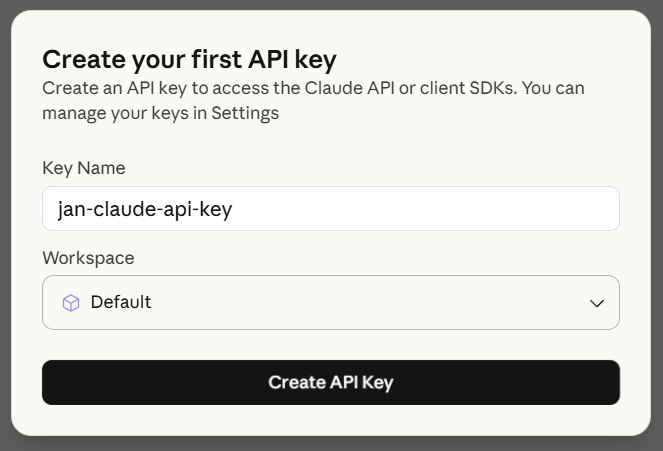
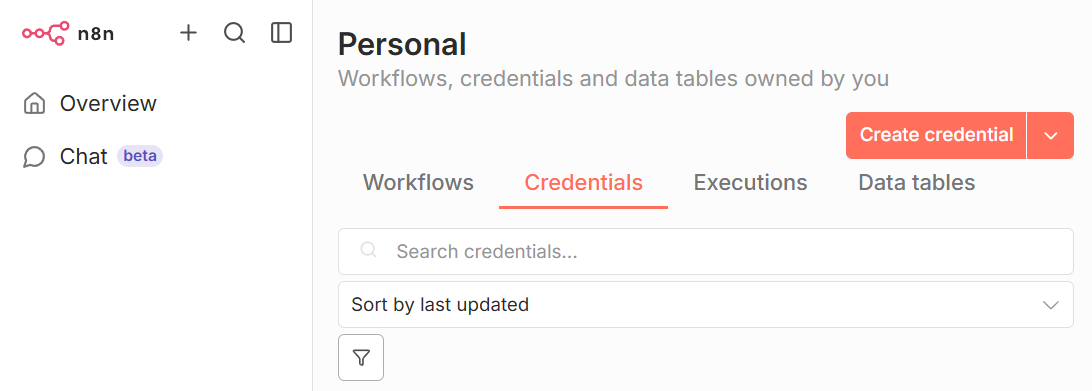
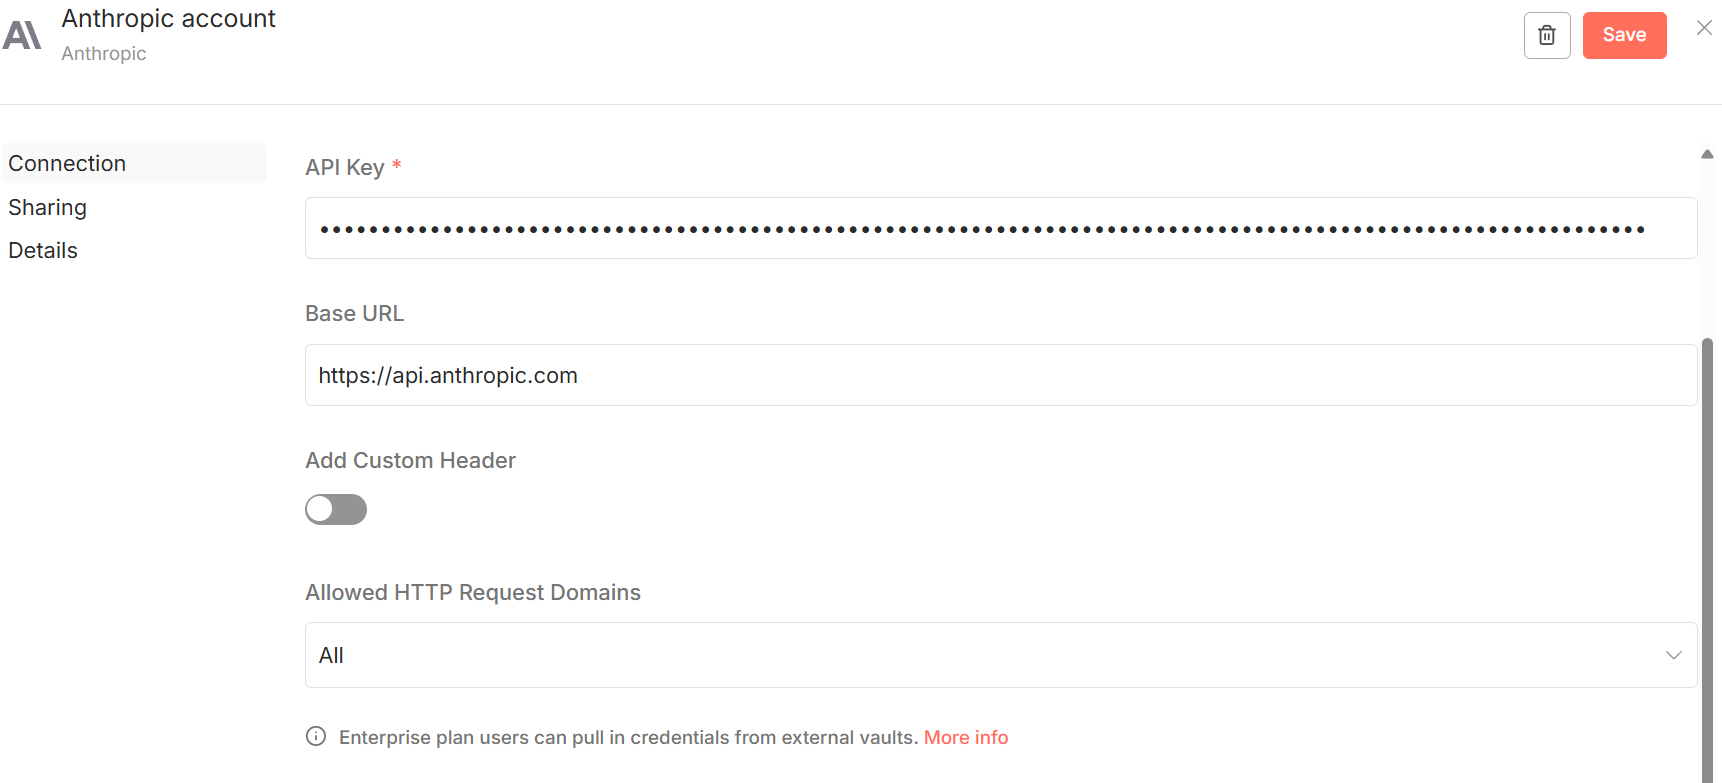
- Copy over the key and head to n8n. Add a new credential (in case you cannot find this section, then create a blank workflow and add a step for Anthropic and create the credential then):
Connect n8n with Discord
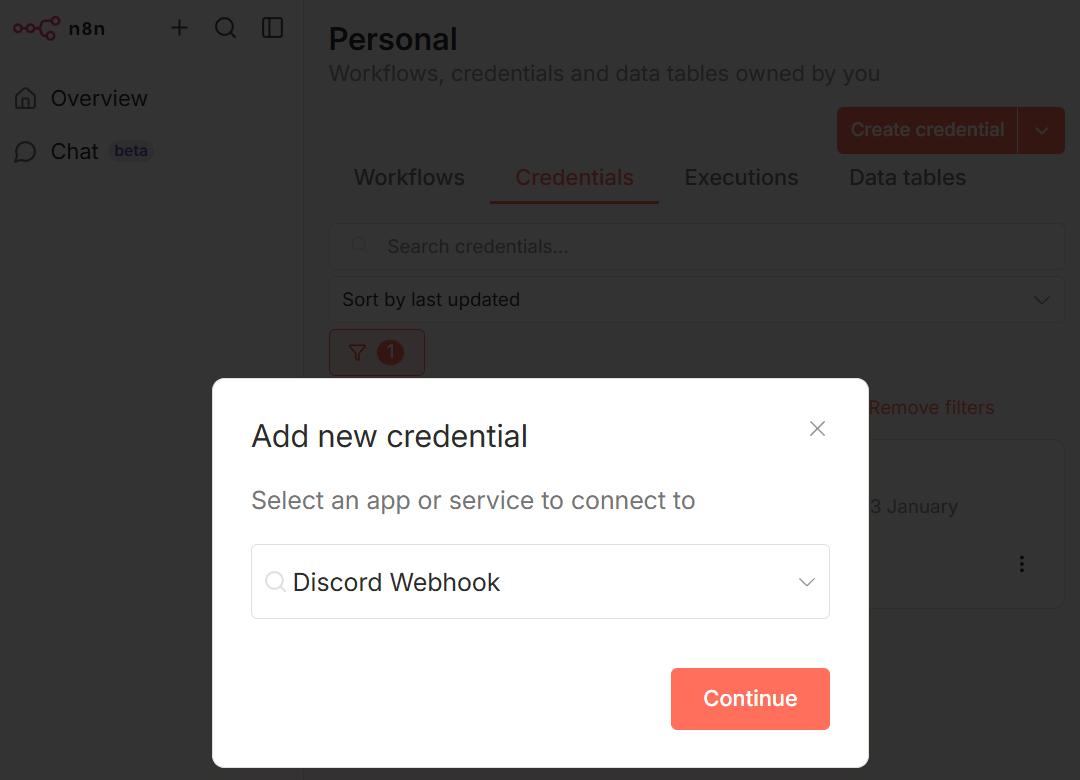
- In n8n, add another credential for a Discord webhook:
- On Discord, modify your existing server / channel settings and add a new webhook (or create a new server if you do not have one already):
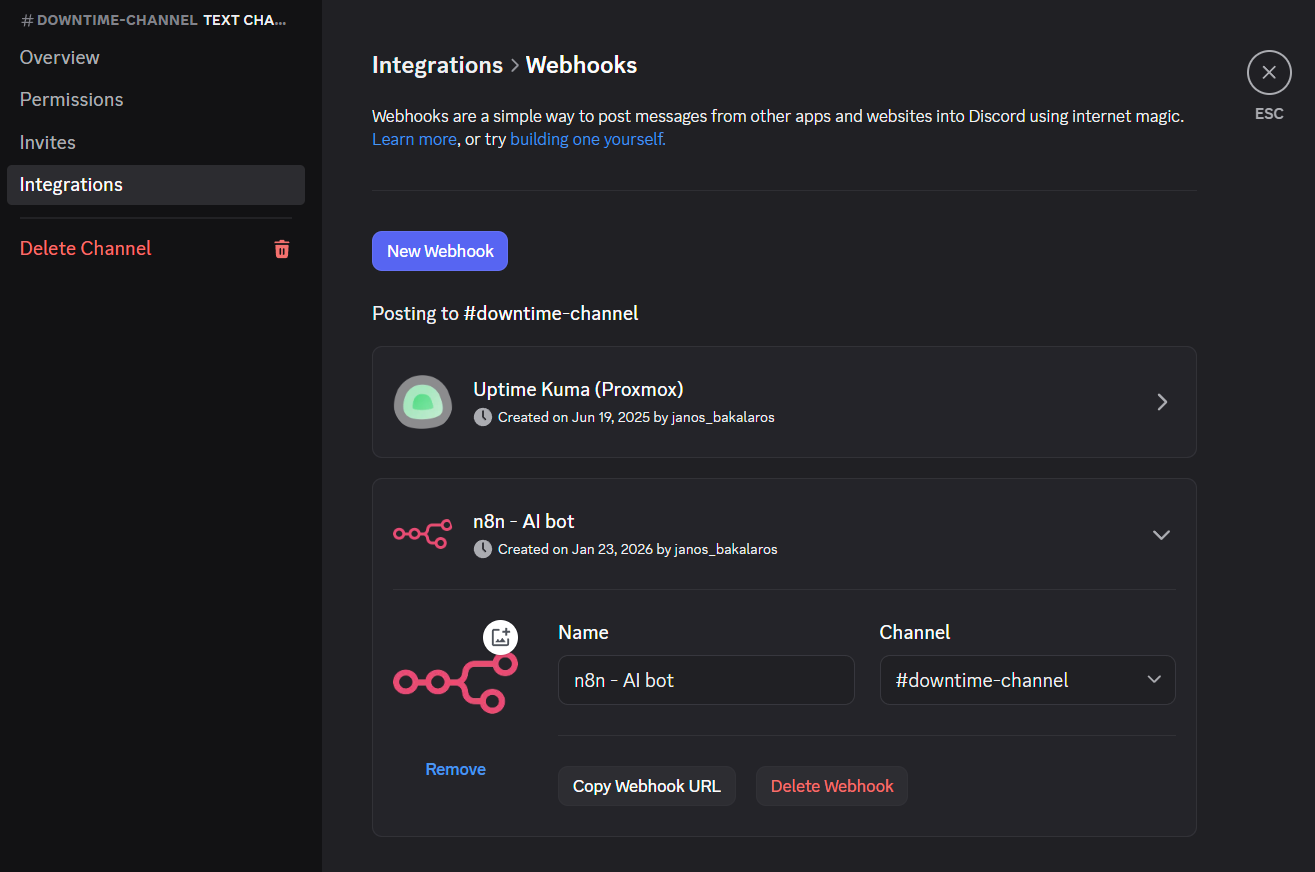
- Copy the webhook URL and paste it into the window in n8n that expects the URL with the webhook data.
2. Create An Infrastructure Monitor Workflow
This is a passive (analysis-only) workflow where we let Claude (or another LLM) process the results of the metrics and recommend next steps. It’s a good starter, esp. if you are new to n8n and find the more advanced workflow in the next Step overwhelming.
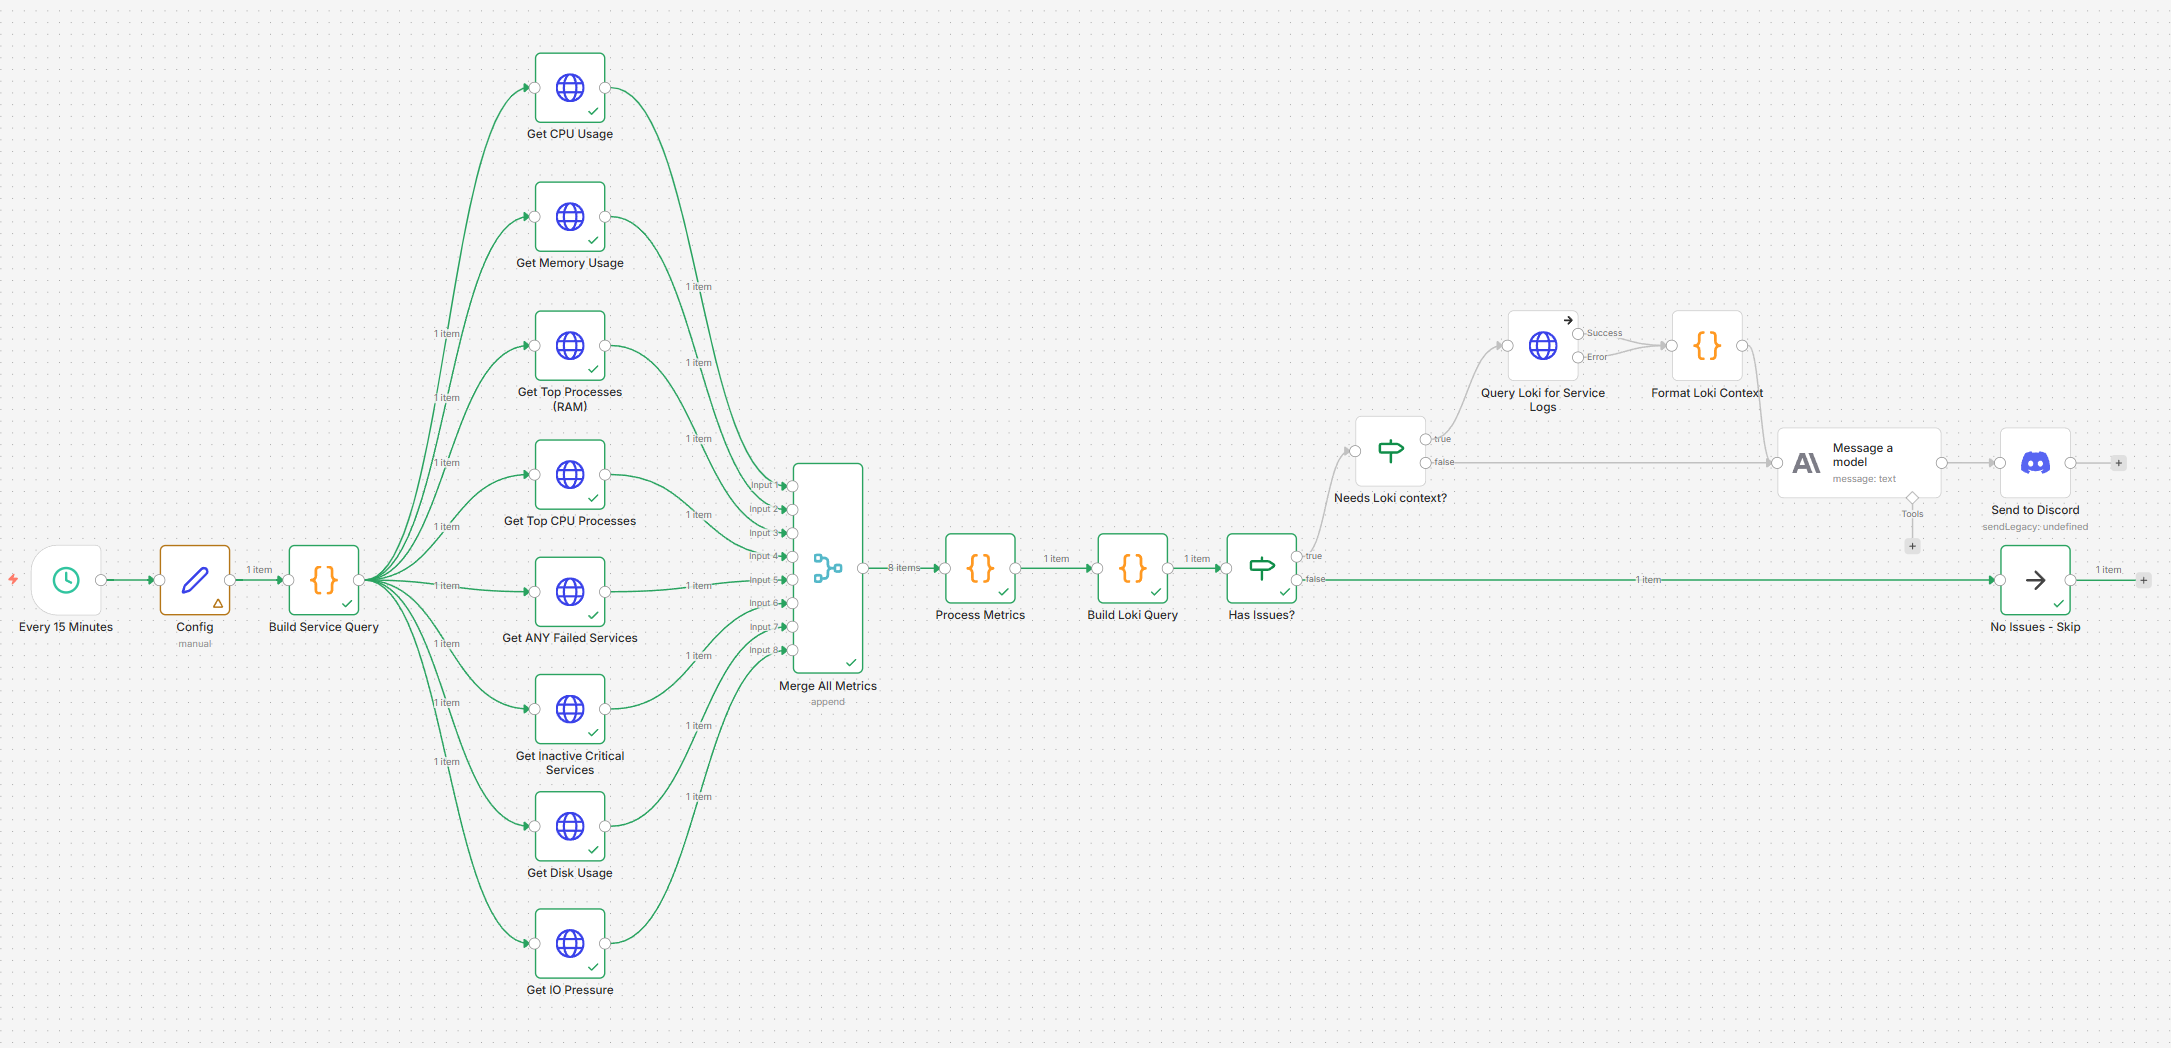
- In this workflow, we fetch data from Prometheus in terms of (a) CPU / RAM / Disk usage and (b) service outages (inactive for critical ones and failed for any). Firstly, the metrics are all merged together and then processed together in one JSON.
- Then, the ‘brain’ of the workflow kicks in with custom JS code that processes the metrics to see if an alert needs to be sent.
- We pull out relevant logs from Loki in relation to failed or inactive
systemdservices that can be used to make a better judgement on why the failure occurred. - In addition, it checks a file saved in
/home/node/.n8n/alert-cache-advisory.jsonto see what alerts were sent previously (default is for up to the last 8 hours). This is to avoid a situation when you get repeatedly spammed with the same issue if you let this workflow run every 15-30 mins. - If an alert needs to be sent, the metrics are forwarded to Claude (or your preferred vendor) to make sense of it and recommend a solution. A message on Discord is then sent out.
Import The ‘Infrastructure AI Advisory’ Workflow
Good news, the hard work of putting it together has already been done for you! Simply import the workflow into your n8n instance.
📎 [Infrastructure Advisory 1.1.json](attachments/Infrastructure Advisory 1.1.json)
What to do after the import
- Read the sticky notes on what needs to be set up in terms of the ‘Config’ node.
- Add credentials for the relevant services, such as:
- Discord Webhook API
- Claude API
- Prometheus/Loki if you use any authentication (off by default)
- Review the Config node - read the sticky notes 😇
- Give it a test run! Fix any errors related to variables/credentials that you may find.
Specifics for detections
- The Get Disk Usage node looks only at the
/mountpoint, not others - you may wish to modify it as per your requirements. This applies to both workflows in this tutorial. - For all hosts in both workflows, it is assumed that they have a hostname-based label, not just an IP address. Check out the Process Metrics node around row no.30 with the
stripDomain()helper function to get to the hostname from FQDN. I included an exception if an IP address is found to not strip to down to the first octet. - Exceptions in the Build Service node - while most services run as ‘
systemd.service’, in my case, I run some services suc hasphp-fpm.service,syncthing.serviceandpostfix.serviceunder different users (such as[email protected]). For this reason, I included a regex pattern in this node (row no.9 - search for ‘// Build regex patterns for each service’). Feel free to adjust it per your needs.
Output On Discord
- In my case, a few things got flagged:

- No alterations are made, AI is used purely in an advisory role.
We demonstrated a simple workflow that processes recent metrics, fetches logs when appropriate and alerts you via Discord. The previous cache on repeated alerts is useful to avoid the situation of getting spammed.
But how about we increase the ‘fun’ and allow AI to handle some of the remediation tasks (that we pre-define) over our infrastructure? So that we move from just recommending the corrective action into also implementing it? Dive with me into part 2 of this tutorial if you feel brave enough 😎
3. Plan For An AI-Driven Workflow To Remedy Common Issues
In order to add AI into the picture and entrust it with some degree of autonomy, we will need to leverage what we already built in this tutorial + utilize an automation platform that will execute pre-defined jobs in a controlled fashion.
This is a ‘middle-ground’ approach where we do not give AI full autonomy over the infrastructure but keep some level of control. Let me expand on that.
Automation Platform - AWX or Semaphore UI
The following workflow is built with two automation platforms in mind - AWX and Semaphore. If you use another one that supports Ansible (such as Spacelift or Rundeck), you will need to revise the URLs for launching and polling jobs and set up separate credentials, but most of the steps will still apply.
- Do you not have an automated platform deployment app built on Ansible set up yet? Catch up by following this tutorial on how to Deploy Ansible AWX to automate OS patching.
Risk Register For AI-driven workflows
To put it simply, we need to decide what activity constitutes a low, medium and high risk operation and to what degree we allow AI to handle it. Find some examples below:
- Low risk - operations that when executed, would be unlikely to lead to service outage. Metrics may indicate that if nothing is done, an outage would eventually occur, such as disk running out or RAM / CPU usage is > 90% for more than 5 minutes. Alternatively, when a service is stopped (such as the example with fail2ban). In this case, a Discord query is sent with a request to approve an action. Timeout 5 minutes. If no response the workflow will proceed.
- Medium risk - operations that may lead to a short but controlled outage. Example includes a reboot of a VM or an LXC container and restarting processes. A Discord approval request is sent with a timeout of 15 minutes. If no response is provided, implement it anyway.
- High risk - operations that, when implemented, could lead to unexpected outcomes. For example, when suggesting infrastructure changes such as moving a VM/container from one Proxmox host to another due to more storage/RAM/CPU availability. In addition, reboots of Type 1 hypervisors would fall under this category (this is defined in the AI prompt). This could be problematic when HA is implemented (such as on a Galera cluster). In this case, an alert can be sent to Discord with a timeout of 1 hour and if no response is given (or a rejection), then do NOT proceed.
An Approval Cycle With Discord
Previously we utilized Discord to send us notifications on what needs fixing with recommended steps to do so. Now, we will utilize Discord as a means of two-way communication to approve or reject a change. And for some items, we can define that they will be implemented anyway if there is no response. This brings us to a ‘risk register’.
| Feature | Low Risk | Medium Risk | High Risk |
|---|---|---|---|
| Examples | Restart service, Clear disk | Reboot host, Kill process | VM migration, Type-1 hypervisor reboots |
| Timeout | 5 minutes | 15 minutes | 60 minutes |
| On Timeout | ✅ APPROVE | ✅ APPROVE | ❌ DENY |
| Cancel with | ❌ Reply | ❌ Reply | ❌ Reply |
| Approve with | ✅ Reply | ✅ Reply | ✅ Reply |
Five Stage Approach (Diagrams)
Do you like Mermaid diagrams? You can download the full version below (the Stages described below are redacted for easier readibility):
📎 remediation-workflow.mermaid
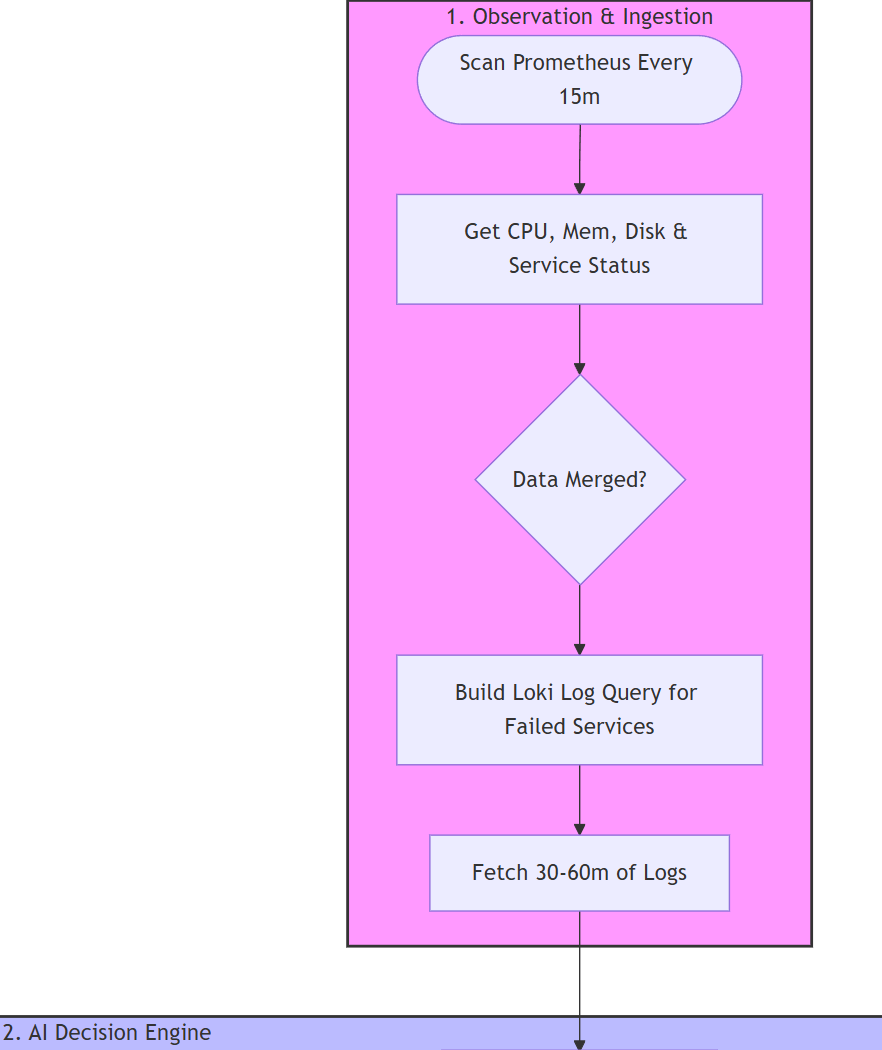
- Stage 1: Gather metrics from each host
- Get CPU logs (available and top consumers)
- Get RAM logs (available and top consumers)
- Get Disk usage logs
- Get Disk I/O pressure logs
- Get inactive / deactivating for critical services (pre-defined in our variables)
- Get failed services
- Fetch relevant logs from Loki for systemd services that are not working
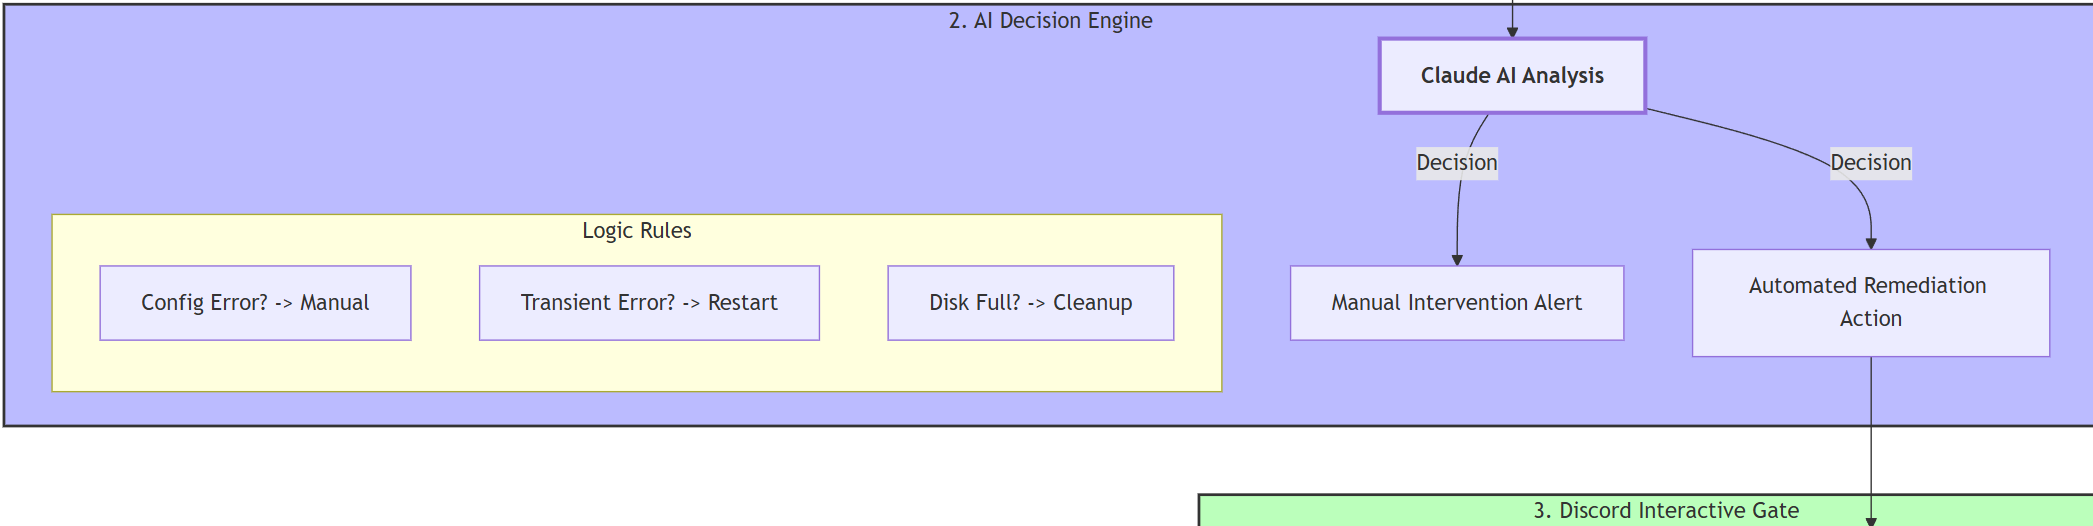
- Stage 2: AI-decision engine
- AI analysis of the logs:
- No issues - workflow finishes
- Issues without pre-defined templates - manual intervention required
- Issues with pre-defined templates - a template ID is matched
- Templates available - you can add your own. At the time of deployment, AI can assign one of the following:
- Systemd is inactive / stopped → restart a service
- Disk utilization is over a threshold (or close to it) → run a disk space clean up job
- System issues (not responsive) → trigger a reboot job
- A process is not responding or faces RAM leak → call kill a process job
- AI analysis of the logs:
- Stage 3: Discord Interaction
- Categorize the failures based on a risk register (low, medium, high) - more about that below.
- Utilize a Discord bot to post a summary of issues (if more than 2 issues) and the proposed solution for the Sysadmin to approve or reject with pre-defined timeout periods.
- Low and medium level risk jobs get auto-approved on timeout.
- Findings get saved in a file to ensure that subsequent runs do not flag the same issue for a pre-defined amount of hours (default is 8). This value can be changed in the ‘Config’ node.
- A request is sent to the respective automation platform (AWX / Semaphore) to trigger the job selected by AI.

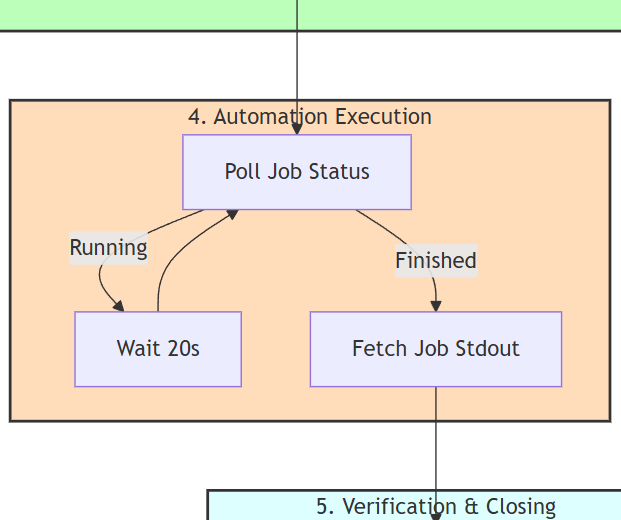
- Stage 4 - Automation Execution
- Monitor the AWX or Semaphore job on a regular basis (every 20 seconds)
- Get results for further processing by AI in the next stage
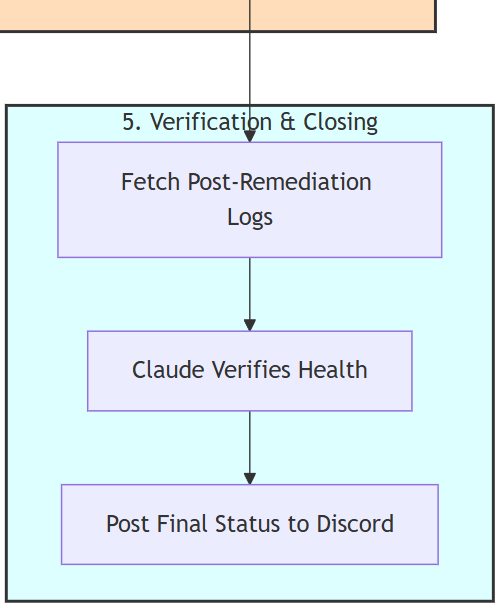
- Stage 5 - Verification & Closing
- Get logs from the automation platform
- Get additional logs via Loki to confirm the result
- Process the logs from both sources by AI
- Post on Discord a structured feedback
- If more additional issues were flagged earlier, loop back to stage 2 for additional requests to be approved.
Now when the structure is explained, we will need to set up those templates.
4. Create AWX/Semaphore Remediation Jobs
If we take a step back, the automation platform will need to handle the following:
- The workflow is triggered on a regular basis (e.g. every 15-30 minutes) from n8n and logs are analyzed using Prometheus API. Additional logs from Loki are pulled for failing/inactive critical system services.
- AI makes a judgement on the severity and type of action that needs to be taken.
- Discord notification is fired up with a timeout respective to the level of risk.
- If approved (or is auto-passed on time out), Claude (or another AI of your choice) decides which playbook in AWX or Semaphore to run.
- n8n calls AWX or Semaphore UI API to launch one of the respective playbook per job. Each one of them can take
service_nameandtarget_hostas variables passed on from n8n to AWX:restart-service.ymlclear-disk-space.ymlreboot-host.ymlkill-process.yml
- AWX or Semaphore UI handle SSH, credentials, logging (this was already set up in a guide I referenced above).
- The n8n workflow waits for the results and informs the admin via Discord. Then loops back in case more issues were identified.
Create Ansible playbooks
- In your source version control tool, create a new folder (I called mine
ansible-remediation). See below for the structure:
ansible-remediation/
├── playbooks/
│ ├── restart-service.yml
│ ├── clear-disk-space.yml
│ ├── reboot-host.yml
│ ├── kill-process.yml
├── inventory/
│ └── (use existing dynamic inventory or add custom hosts)
└── README.md
Playbook: restart-service.yml
---
# Restart a failed systemd service
# Variables: target_host, service_name
# Risk: LOW

- name: Restart Failed Service
  hosts: "{{ target_host }}"
  become: yes
  gather_facts: no

  vars:
    max_retries: 3
    retry_delay: 5

  tasks:
    - name: Check current service status
      ansible.builtin.systemd:
        name: "{{ service_name }}"
      register: service_before
      failed_when: false

    - name: Fail if service does not exist
      ansible.builtin.fail:
        msg: "Service {{ service_name }} does not exist on {{ target_host }}"
      when: service_before.status is not defined

    - name: Restart the service
      ansible.builtin.systemd:
        name: "{{ service_name }}"
        state: restarted
      register: restart_result
      failed_when: false

    - name: Wait for service to stabilize
      ansible.builtin.systemd:
        name: "{{ service_name }}"
      register: service_after
      until: service_after.status.ActiveState in ['active', 'running']
      retries: "{{ max_retries }}"
      delay: "{{ retry_delay }}"
      failed_when: false

    - name: Set result fact
      ansible.builtin.set_fact:
        remediation_result:
          success: "{{ service_after.status.ActiveState | default('unknown') in ['active', 'running'] }}"
          service: "{{ service_name }}"
          host: "{{ target_host }}"
          state_before: "{{ service_before.status.ActiveState | default('unknown') }}"
          state_after: "{{ service_after.status.ActiveState | default('failed') }}"
          restart_attempted: "{{ restart_result is success }}"
          message: "{{ 'Service ' + service_name + ' restarted successfully, now ' + (service_after.status.ActiveState | default('unknown')) if service_after.status.ActiveState | default('unknown') in ['active', 'running'] else 'Service ' + service_name + ' failed to restart, state: ' + (service_after.status.ActiveState | default('unknown')) }}"

    - name: Output result
      ansible.builtin.debug:
        var: remediation_result
Playbook: clear-disk-space.yml
---
# Clean space on a drive & identify large files
# Variables: target_host
# Risk: LOW

---
- name: Clear disk space and analyze usage
  hosts: "{{ target_host }}"
  become: yes
  tasks:
    - name: Get disk usage before cleanup
      command: df -h /
      register: disk_before

    - name: Find largest directories in /var
      shell: du -sh /var/*/ 2>/dev/null | sort -rh | head -10
      register: var_usage
      ignore_errors: yes

    - name: Find largest files over 100MB (ignore external storage)
      ansible.builtin.shell: |
        find / -xdev -type f -size +100M 2>/dev/null | head -20
      async: 300        # 5 minute max
      poll: 10
      register: large_files
      ignore_errors: yes

    - name: Check apt cache size
      shell: du -sh /var/cache/apt/archives 2>/dev/null || echo "0 /var/cache/apt/archives"
      register: apt_cache
      ignore_errors: yes

    - name: Check journal size
      shell: journalctl --disk-usage 2>/dev/null || echo "Journal size unknown"
      register: journal_size
      ignore_errors: yes

    - name: Check docker disk usage
      shell: docker system df 2>/dev/null || echo "Docker not installed"
      register: docker_usage
      ignore_errors: yes

    - name: Clean apt cache
      apt:
        autoclean: yes
        autoremove: yes
      ignore_errors: yes

    - name: Clean old journal logs
      shell: journalctl --vacuum-time=7d
      register: journal_cleaned
      ignore_errors: yes

    - name: Clean tmp files older than 7 days
      shell: find /tmp -type f -mtime +7 -delete 2>/dev/null || true
      ignore_errors: yes

    - name: Clean old log files
      shell: |
        find /var/log -type f -name "*.gz" -mtime +30 -delete 2>/dev/null || true
        find /var/log -type f -name "*.old" -delete 2>/dev/null || true
      ignore_errors: yes

    - name: Get disk usage after cleanup
      command: df -h /
      register: disk_after

    - name: Display report
      vars:
        report_text: |
          ========== DISK CLEANUP REPORT ==========

          BEFORE cleanup: {{ disk_before.stdout_lines[1] | default('unknown') }}
          AFTER cleanup:  {{ disk_after.stdout_lines[1] | default('unknown') }}

          === Top 10 directories in /var ===
          {{ var_usage.stdout | default('Unable to scan') }}

          === Large files over 100MB ===
          {{ large_files.stdout | default('None found') }}

          === Cache and Log sizes ===
          APT Cache: {{ apt_cache.stdout | default('unknown') }}
          Journal: {{ journal_size.stdout | default('unknown') }}

          === Docker usage ===
          {{ docker_usage.stdout | default('Not available') }}

          === Cleanup actions performed ===
          Journal vacuum: {{ journal_cleaned.stdout | default('skipped') }}

          === Recommendations ===
          Review large files above for potential removal
          Check /var/log for application-specific logs
          Consider docker system prune if Docker usage is high
          ==========================================
      debug:
        msg: "{{ report_text }}"
Playbook: reboot-host.yml
---
# Reboot a host
# Variables: target_host
# Risk: MEDIUM

- name: Reboot Host
  hosts: "{{ target_host }}"
  become: yes
  gather_facts: no

  vars:
    reboot_timeout: 300

  tasks:
    - name: Record uptime before reboot
      ansible.builtin.command: uptime -s
      register: uptime_before
      changed_when: false

    - name: Reboot the host
      ansible.builtin.reboot:
        reboot_timeout: "{{ reboot_timeout }}"
        msg: "Automated reboot initiated by n8n remediation workflow"

    - name: Record uptime after reboot
      ansible.builtin.command: uptime -s
      register: uptime_after
      changed_when: false

    - name: Verify host is responsive
      ansible.builtin.ping:

    - name: Set result fact
      ansible.builtin.set_fact:
        remediation_result:
          success: true
          host: "{{ target_host }}"
          uptime_before: "{{ uptime_before.stdout }}"
          uptime_after: "{{ uptime_after.stdout }}"
          message: "Host {{ target_host }} rebooted successfully. Was up since {{ uptime_before.stdout }}, now up since {{ uptime_after.stdout }}"

    - name: Output result
      ansible.builtin.debug:
        var: remediation_result
Playbook: kill-process.yml
---
# Kill a runaway process
# Variables: target_host, process_name or process_pid, signal (optional, default TERM)
# Risk: MEDIUM

- name: Kill Runaway Process
  hosts: "{{ target_host }}"
  become: yes
  gather_facts: no

  vars:
    kill_signal: "{{ signal | default('TERM') }}"
    use_pid: "{{ process_pid is defined and process_pid | string | length > 0 }}"
    use_name: "{{ process_name is defined and process_name | string | length > 0 }}"

  tasks:

    # Input validation
    - name: Validate that at least one target is provided
      ansible.builtin.assert:
        that:
          - use_pid | bool or use_name | bool
        fail_msg: "Either process_name or process_pid must be provided"

    - name: Validate process_name contains only safe characters
      ansible.builtin.assert:
        that:
          - process_name is regex('^[a-zA-Z0-9._:/@*? -]+$')
        fail_msg: "Invalid process name '{{ process_name }}' - contains disallowed characters"
      when: use_name | bool

    - name: Validate process_pid is numeric
      ansible.builtin.assert:
        that:
          - process_pid | string is regex('^[0-9]+$')
        fail_msg: "Invalid PID '{{ process_pid }}' - must be numeric"
      when: use_pid | bool

    - name: Validate kill signal
      ansible.builtin.assert:
        that:
          - kill_signal is regex('^[A-Z0-9]+$')
        fail_msg: "Invalid signal '{{ kill_signal }}'"

    # Discover PIDs
    # When a PID is provided, use it directly. When only a name is given,
    # find matching PIDs. Never do both - PID takes precedence.

    - name: Find PIDs by process name
      ansible.builtin.shell: >
        pgrep -x '{{ process_name }}' | head -5
      register: found_pids
      changed_when: false
      failed_when: false
      when: use_name | bool and not (use_pid | bool)

    - name: Fall back to full command-line match if exact match found nothing
      ansible.builtin.shell: >
        pgrep -f '{{ process_name }}' | head -5
      register: found_pids_fuzzy
      changed_when: false
      failed_when: false
      when:
        - use_name | bool
        - not (use_pid | bool)
        - found_pids.stdout_lines | default([]) | length == 0

    # Determine if process of PID is to be used
    - name: Set target PIDs
      ansible.builtin.set_fact:
        pids_to_kill: >-
          {{
            [process_pid | string] if (use_pid | bool)
            else (found_pids.stdout_lines | default([]))
                 if (found_pids.stdout_lines | default([]) | length > 0)
            else (found_pids_fuzzy.stdout_lines | default([]))
          }}

      # Fail-safe
    - name: Fail if no matching processes found
      ansible.builtin.fail:
        msg: >-
          No processes found matching
          {{ ('PID ' + process_pid | string) if (use_pid | bool)
             else ('name "' + process_name + '"') }}
          on {{ target_host }}
      when: pids_to_kill | length == 0

    # Capture state before kill
    - name: Get process details before kill
      ansible.builtin.shell: >
        ps -p {{ pids_to_kill | join(',') }} -o pid,user,%cpu,%mem,start,command --no-headers 2>/dev/null || true
      register: process_details
      changed_when: false

    # Kill the process
    - name: Send signal to target PIDs
      ansible.builtin.shell: "kill -{{ kill_signal }} {{ item }}"
      loop: "{{ pids_to_kill }}"
      register: kill_results
      failed_when: false

    # Verify - adjust as per your needs
    - name: Wait for processes to terminate
      ansible.builtin.pause:
        seconds: 9

    - name: Check if PIDs are still running
      ansible.builtin.shell: "ps -p {{ pids_to_kill | join(',') }} -o pid= 2>/dev/null | wc -l"
      register: remaining
      changed_when: false
      failed_when: false

    - name: Escalate to SIGKILL if TERM did not work
      ansible.builtin.shell: "kill -KILL {{ item }}"
      loop: "{{ pids_to_kill }}"
      when:
        - remaining.stdout | default('0') | trim | int > 0
        - kill_signal == 'TERM'
      register: kill_escalation
      failed_when: false

    - name: Wait after SIGKILL escalation
      ansible.builtin.pause:
        seconds: 2
      when:
        - remaining.stdout | default('0') | trim | int > 0
        - kill_signal == 'TERM'

    - name: Final verification
      ansible.builtin.shell: "ps -p {{ pids_to_kill | join(',') }} -o pid= 2>/dev/null | wc -l"
      register: final_remaining
      changed_when: false
      failed_when: false

    - name: Set result fact
      ansible.builtin.set_fact:
        remediation_result:
          success: "{{ final_remaining.stdout | default('0') | trim | int == 0 }}"
          host: "{{ target_host }}"
          process: "{{ process_name | default(process_pid | string) }}"
          pids_killed: "{{ pids_to_kill }}"
          signal_sent: "{{ kill_signal }}"
          escalated_to_kill: "{{ (remaining.stdout | default('0') | trim | int > 0) and kill_signal == 'TERM' }}"
          details_before: "{{ process_details.stdout | default('N/A') }}"
          message: >-
            {{
              'Process ' + (process_name | default(process_pid | string))
              + ' (PIDs: ' + (pids_to_kill | join(', '))
              + ') killed successfully with ' + kill_signal
              + (' (escalated to SIGKILL)' if ((remaining.stdout | default('0') | trim | int > 0) and kill_signal == 'TERM') else '')
              if (final_remaining.stdout | default('0') | trim | int == 0)
              else 'Process ' + (process_name | default(process_pid | string))
              + ' may still be running after ' + kill_signal + ' + SIGKILL signals'
            }}

    - name: Output result
      ansible.builtin.debug:
        var: remediation_result
File: README.md
- Written by Claude 4.6 based on my notes and code analysis
# Ansible Remediation Playbooks

Automated remediation playbooks designed to be triggered by an AI-powered n8n
workflow via AWX or Semaphore UI. These playbooks handle common infrastructure
issues detected through Prometheus and Loki monitoring.

## Requirements

- Ansible 2.12+
- Target hosts must be accessible via SSH with sudo privileges
- Designed for Debian/Ubuntu-based systems (apt, systemd, journalctl)
  - `clear-disk-space.yml` uses `apt` for cache cleanup; adapt for RHEL/CentOS
- AWX or Semaphore UI configured with machine credentials for target hosts

## Playbooks

| Playbook | Risk Level | Description | Required Variables |
|----------|-----------|-------------|-------------------|
| `restart-service.yml` | LOW | Restarts a failed systemd service with retry logic and state verification | `target_host`, `service_name` |
| `clear-disk-space.yml` | LOW | Cleans temporary files, apt cache, old journals, and reports disk usage | `target_host` |
| `reboot-host.yml` | MEDIUM | Reboots host with pre/post diagnostics and connectivity verification | `target_host` |
| `kill-process.yml` | MEDIUM | Terminates a runaway process by name or PID with verification | `target_host`, `process_name` (or `process_pid`), `signal` (optional, default: TERM) |

## Variables

All playbooks require `target_host` — the inventory hostname of the target.
Variables are passed as extra_vars from n8n via the AWX/Semaphore API.

### Optional Variables

| Variable | Playbook | Default | Description |
|----------|----------|---------|-------------|
| `service_name` | restart-service | *(required)* | systemd unit name (e.g., `nginx.service`) |
| `process_name` | kill-process | — | Process name for `pkill` |
| `process_pid` | kill-process | — | Specific PID to kill |
| `signal` | kill-process | `TERM` | Kill signal (`TERM`, `KILL`, `HUP`, etc.) |
| `max_retries` | restart-service | `3` | Retry count for service stabilization |
| `retry_delay` | restart-service | `5` | Seconds between retries |
| `reboot_timeout` | reboot-host | `300` | Seconds to wait for host to come back |

## Output Format

All playbooks set a `remediation_result` fact and output it via `debug`.
This structured output is consumed by the n8n workflow for AI analysis.

Example:
```json
{
  "remediation_result": {
    "success": true,
    "host": "web1",
    "service": "fail2ban.service",
    "state_before": "inactive",
    "state_after": "active",
    "message": "Service fail2ban.service restarted successfully, now active"
  }
}
Safety Features
- No user data deletion:
clear-disk-spaceonly removes system cache, old logs (>30 days), and temp files (>7 days) - Graceful termination:
kill-processdefaults to SIGTERM, allowing processes to clean up before exit, only then proceeds to SIGKILL. - State verification: All playbooks verify the outcome before reporting success
- Pre/post diagnostics:
reboot-hostcaptures uptime, dmesg, and service status before and after reboot
Manual Testing
Before connecting to the automated workflow, test each playbook manually:
# Test restart-service
ansible-playbook playbooks/restart-service.yml \
  -e target_host=web1 \
  -e service_name=fail2ban.service

# Test clear-disk-space
ansible-playbook playbooks/clear-disk-space.yml \
  -e target_host=proxmox3

# Test reboot-host (CAUTION: this will reboot the target)
ansible-playbook playbooks/reboot-host.yml \
  -e target_host=test-vm

# Test kill-process
ansible-playbook playbooks/kill-process.yml \
  -e target_host=web1 \
  -e process_name=stress
Integration
These playbooks are triggered by the n8n "Infrastructure Auto-Remediation" workflow. See the full tutorial at: https://bachelor-tech.com/
License
MIT
#### Add Jobs To Your Automation Platform

<u>**In AWX:**</u>

- Sync your source version control tool with AWX (Resources → Projects → click on the ‘Sync’ button) - assuming you have this set up already.
- Add the 4 jobs - one for each template.
    - Ensure you tick the box near the Variables section called ‘Prompt on launch’, so that n8n can pass `target_host` and `service_name` .
    - Similarly, tick the box called ‘Privilege Escalation’ to grant `sudo` permissions (this may not be required if your ansible credential already has `become` configured with a password method).

<p align="center"><a href="assets/14-add-jobs-to-your-automation.png" target="_blank"><img src="assets/14-add-jobs-to-your-automation.png" alt="14 add jobs to your automation" width="300" /></a></p>

- Once you add all four, note their IDs (as per their URL). In my case, these are:
    - R1 - Restart Service - ID: `38`
    - R2 - Clear Disk Space - ID: `39`
    - R3 - Reboot Host - ID: `40`
    - R4 - Kill A Process - ID: `41`
    - (Note: R stands for Remedy)

<p align="center"><a href="assets/15-add-jobs-to-your-automation.png" target="_blank"><img src="assets/15-add-jobs-to-your-automation.png" alt="15 add jobs to your automation" width="300" /></a></p>

- <u>**As for Semaphore UI:**</u>
    - Go to your project →** Task Templates**.
    - The **template ID** is visible in the URL when you click on a template, such as: `https://your-semaphore/project/1/templates/5` → in this example, the template ID is number 5 and the project ID is 1.
    - Enter both values in the **Config **node.

#### **Create an API Token:**

This is to ensure that n8n can reach your automation platform of choice.

- In AWX, go to Users → your user → Tokens → Add
- Scope: `Write`  (leave the Application field empty)
    - Copy the token to your password manager to be used once we import the workflow.

<p align="center"><a href="assets/16-create-an-api-token.png" target="_blank"><img src="assets/16-create-an-api-token.png" alt="16 create an api token" width="300" /></a></p>

With the automated templates being set up, there is one more step we need to do before importing the actual workflow - a Discord bot needs to be configured. This is because of the introduction of an approval workflow that we will introduce into the workflow - to maintain control while valuing AI-assisted automation.

### 5. Discord Bot Set Up

In order to make the workflows interactive within Discord based on what AI determines that needs to be implemented, we will need to set up a bot. It is a relatively simple task but do follow along if you have not done it before. It should take less than 10 minutes.

#### Create a Discord App

- Go to [**https://discord.com/developers/applications**](https://discord.com/developers/applications)
- Click **"New Application"**
- Name it something like `Infrastructure Bot`
- Click on the **Create **button. Agree with the T&C (there may also be a CAPTCHA to pass through).

#### Create a Bot

- In your new application, click **"Bot"** in the left sidebar
- Under **Token**, click on the **"Reset Token" button**
- Copy the token to your password vault, as it will not appear again.

#### Installation Context

- Go to the new ‘Installation’ tab.
- Scroll down to the ‘Install Link’ section and set it to ‘None’.
- Save changes.

#### Configure Bot Settings

- On the Bot page, scroll down and enable:

| Setting | Value |
| --- | --- |
| **Public Bot** | **Off **(only you can add it) |
| **Requires OAuth2 Code Grant** | Off (by default) |
| **Presence Intent** | Off (by default) |
| **Server Members Intent** | Off (by default) |
| **Message Content Intent** | **ON** (required to read messages - vital for our set up) |

#### Set Permissions & Invite Bot

- Go to the** OAuth2 **menu option**.**
- Under **Scopes**, check:
    - `bot`
- Under **Bot Permissions**, check:
    - `Read Message History`
    - `Send Messages`
    - `Add Reactions`
    - `View Channels`
- Copy the generated URL at the bottom - it looks like:

`https://discord.com/api/oauth2/authorize?client_id=123456789&permissions=76800&scope=bot`

<p align="center"><a href="assets/17-set-permissions-invite-bot.png" target="_blank"><img src="assets/17-set-permissions-invite-bot.png" alt="17 set permissions invite bot" width="300" /></a></p>

#### Get Your Channel ID

- In Discord, go to **User Settings** → **Advanced** → Enable **Developer Mode**
- Right-click on your monitoring channel → **"Copy Channel ID"**
- Save the value, such as `1234567890123456789`

With Discord being set up, we can finally import the AI-assisted workflow!

### 6. The AI-Assisted Remediation Workflow Into n8n

Now to the exciting step, the ‘main meal of the day’ - let’s put it all together! Create a new n8n workflow and import the following file:

📎 [Infrastructure Auto-Remediation 1.2.json](attachments/Infrastructure Auto-Remediation 1.2.json)

#### Update Your Variables

- In the ‘Config node’, edit all the variables in there to match your environment. This way, you change these values in one node and do not have to worry about changing it in others.
- As per the sticky notes in the workflow, this includes:
    - **Hosts:Ports** → for Prometheus, Loki and Automation platform (AWX / Semaphore UI)
    - **Discord Channel ID**
    - **Template IDs** to match them to the correct jobs
    - List of **critical services** to monitor (what must be ‘active’)
    - **Timing variables** - ignore repeated issues for x hours, how long should Loki look back in the logs.
    - **Thresholds** - CPU, RAM, disk space, IO pressure values.
    - **Misc **- your timezone and limit for AI token number per interaction (default is 1024) - the bot is advised to respond within that limit to ensure that the JSON file arrives complete (otherwise it might get cut off).

<p align="center"><a href="assets/18-update-your-variables.png" target="_blank"><img src="assets/18-update-your-variables.png" alt="18 update your variables" width="300" /></a></p>

#### Update Your Credentials

- This part is a bit tedious, as you need to add your own credentials for all the hosts and services where you use authentication. Unless there is an easier way that I have not discovered yet, you may need to click through the nodes to ensure that authentication is enabled wherever required.
- Use the time to understand what each node does and to see if it fits into the needs of your environment.
- Ensure that you cover the following:
    - **Discord API** (not webhook!)
    - **Prometheus, Loki** - if you use any authentication (without by default)
    - **Anthropic account** - if you prefer to use another LLM, change the tile and copy paste the text in it.

> 💡 **Note**
>
> When specifying an AWX token, the name needs to be `Authorization` and the Value needs to start with `Bearer <YOUR_TOKEN>` - do not just copy paste the token into it, you need the word Bearer before it.

#### Summary & Manual Interventions

- In this more complex workflow, with more issues being flagged, the list of affected hosts may become overwhelming. For this reason, when two or more issues are found, a summary is sent before diving into each and before the approval workflow kicks in.
- Similarly, some issues may require manual intervention and thus cannot be processed using a pre-defined automated job. Those will be flagged before the approval workflow kicks in with recommended actions (logs from Loki are pulled to provide more accurate information).
- Note: The caching file in the remediation workflow is stored in `/home/node/.n8n/alert-cache.json` (instead of `alert-cache-advisory.json` ).

<p align="center"><a href="assets/19-summary-manual-interventions.png" target="_blank"><img src="assets/19-summary-manual-interventions.png" alt="19 summary manual interventions" width="300" /></a></p>

- Here is an example of what it looks like in practice:

<p align="center"><a href="assets/20-summary-manual-interventions.png" target="_blank"><img src="assets/20-summary-manual-interventions.png" alt="20 summary manual interventions" width="300" /></a></p>

- In case you would prefer it handled differently, you can modify the respective nodes accordingly.

#### Experience With The Approval Workflow

This is the nice touch of this approach - we remain in control of what gets done or not when we approve it, reject it or leave it to time out.

- An example of a low-risk item that is rejected:

<p align="center"><a href="assets/21-experience-with-the-approval.png" target="_blank"><img src="assets/21-experience-with-the-approval.png" alt="21 experience with the approval" width="300" /></a></p>

- An example of low risk item that is timed out and thus carried out (high CPU usage):

<p align="center"><a href="assets/22-experience-with-the-approval.png" target="_blank"><img src="assets/22-experience-with-the-approval.png" alt="22 experience with the approval" width="300" /></a></p>

With variables and credentials being set up and with taking into account how the approval workflow works, we can proceed with some real tests!

### 7. Real Test Scenarios

Now when the workflow is set up and explained, let us look into a few real case scenarios to understand how it works.

#### Test 1 - High CPU Usage

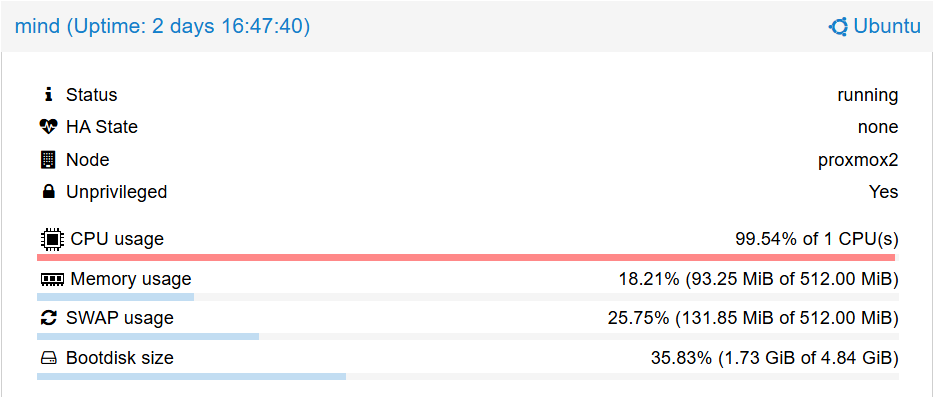
I have simulated a situation when in one LXC (container), I ran the following command to trigger a CPU stress test:

```bash
stress --vm 1 --vm-bytes $(awk '/MemTotal/{printf "%d\n", $2 * 0.8}' /proc/meminfo)k --timeout 600- The CPU started maxing out straight away, as visible in Proxmox:
- After a couple of minutes, the workflow in n8n was executed and the result was clear:

- I approved the remediation to go ahead and a job in AWX was triggered:
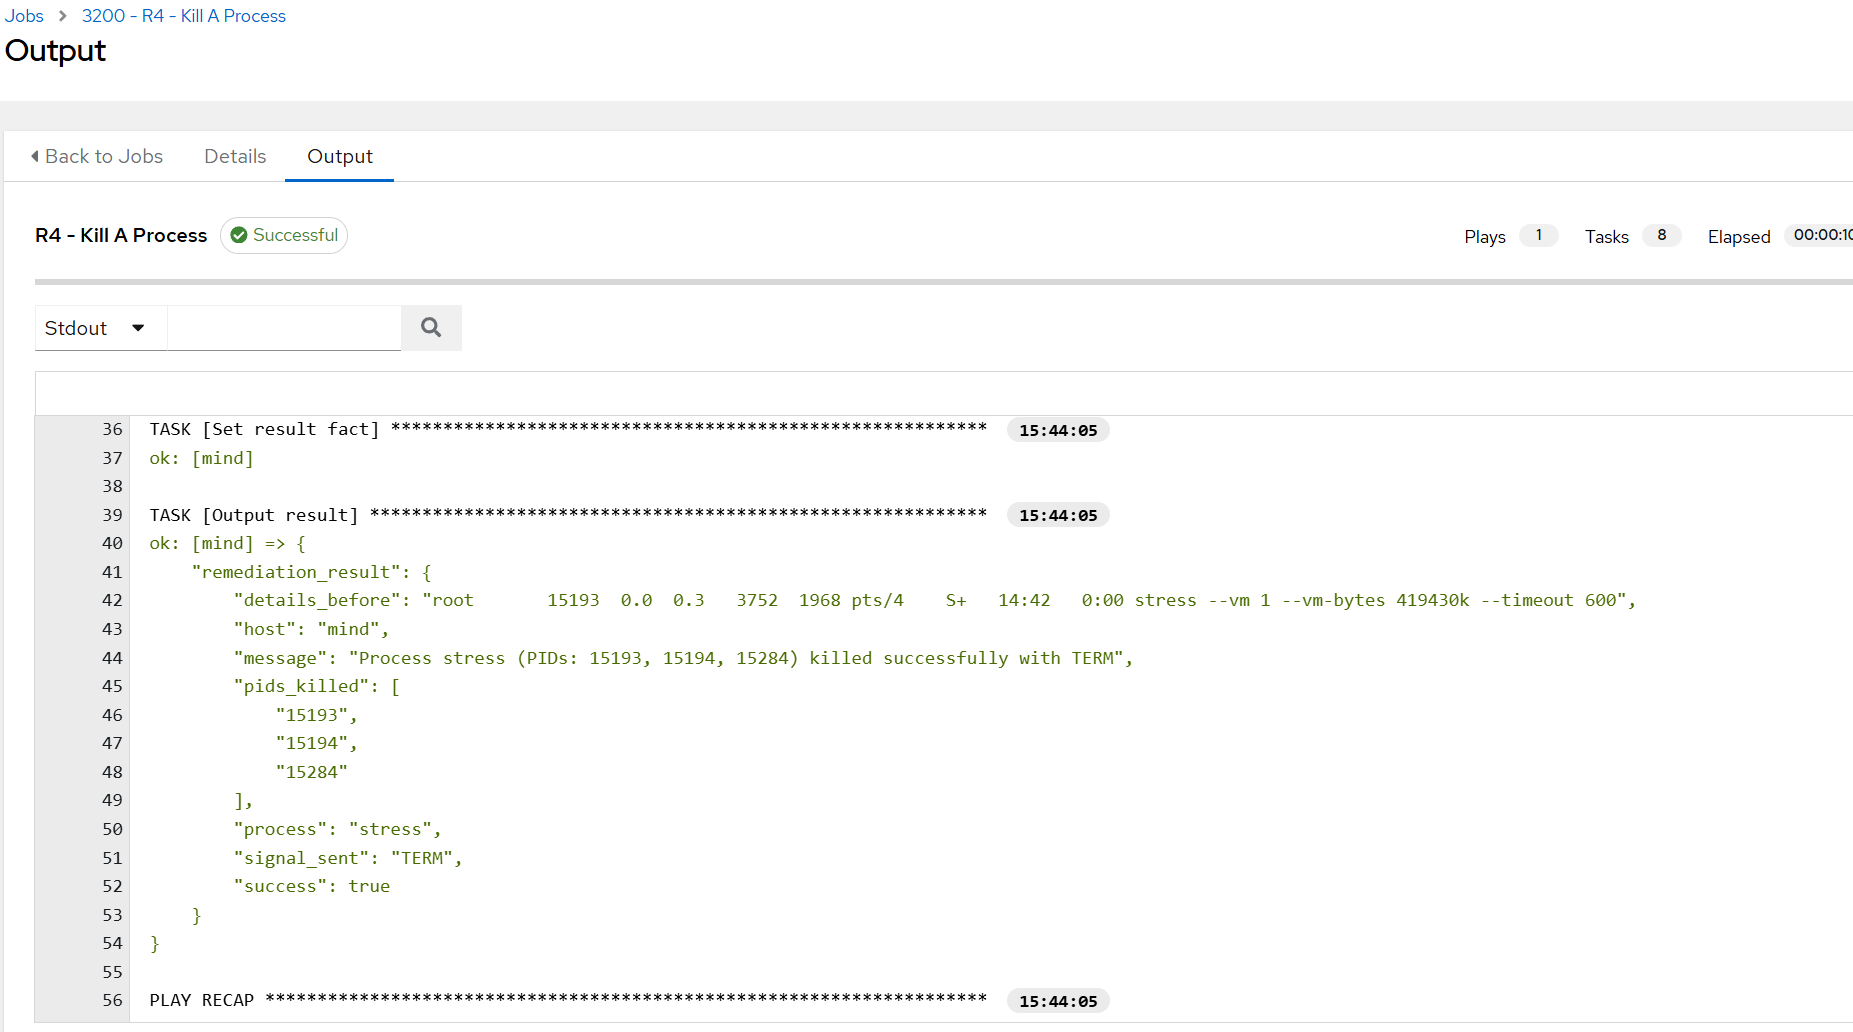
- Since I had the command running in a Terminal, I noticed that it got terminated:

- The Discord message confirmed the findings:

Test 2 - An Inactive Critical Service
-
In this scenario, the
fail2banservice on aweb1VM is made inactive by runningsudo systemctl stop fail2ban. -
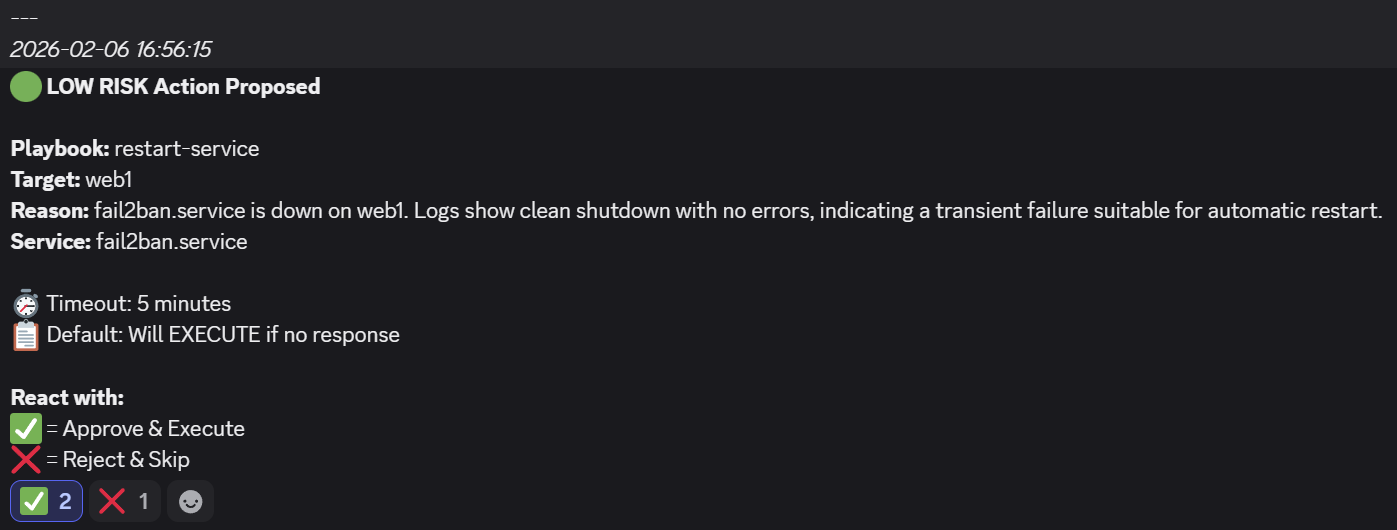
The workflow picks it up on its next run and offers to restart it automatically:
- The workflow triggers an AWX job and confirms that the service is back up:

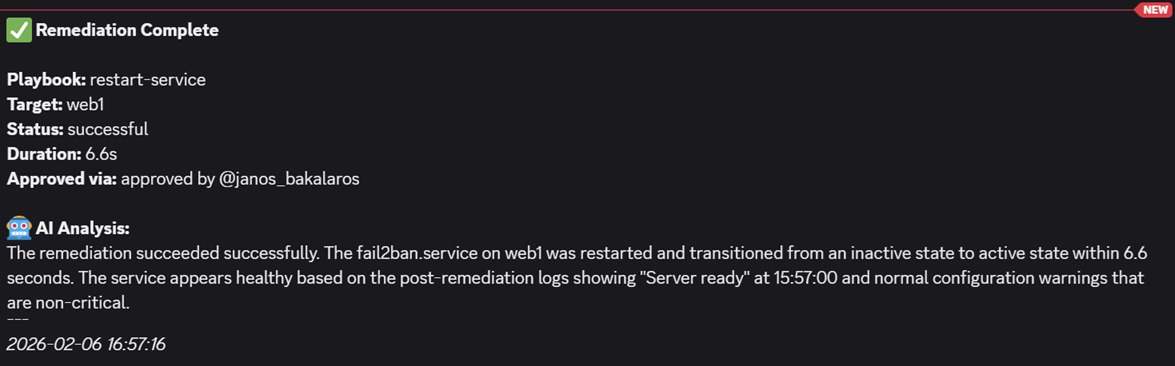
- The result on Discord confirms the findings:
- Now to spice things up a bit, I also made a config error in the
/etc/fail2ban/jail.localfile and then stopped the service. I wanted to see how will AI handle that. As you can see, the analysis explains clearly

Test 3 - Low Disk Space On Proxmox3
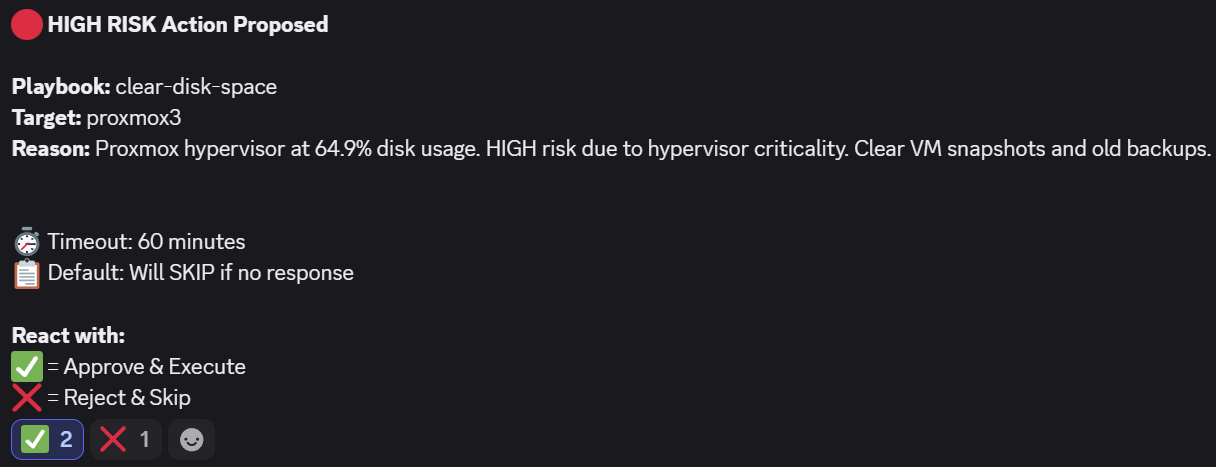
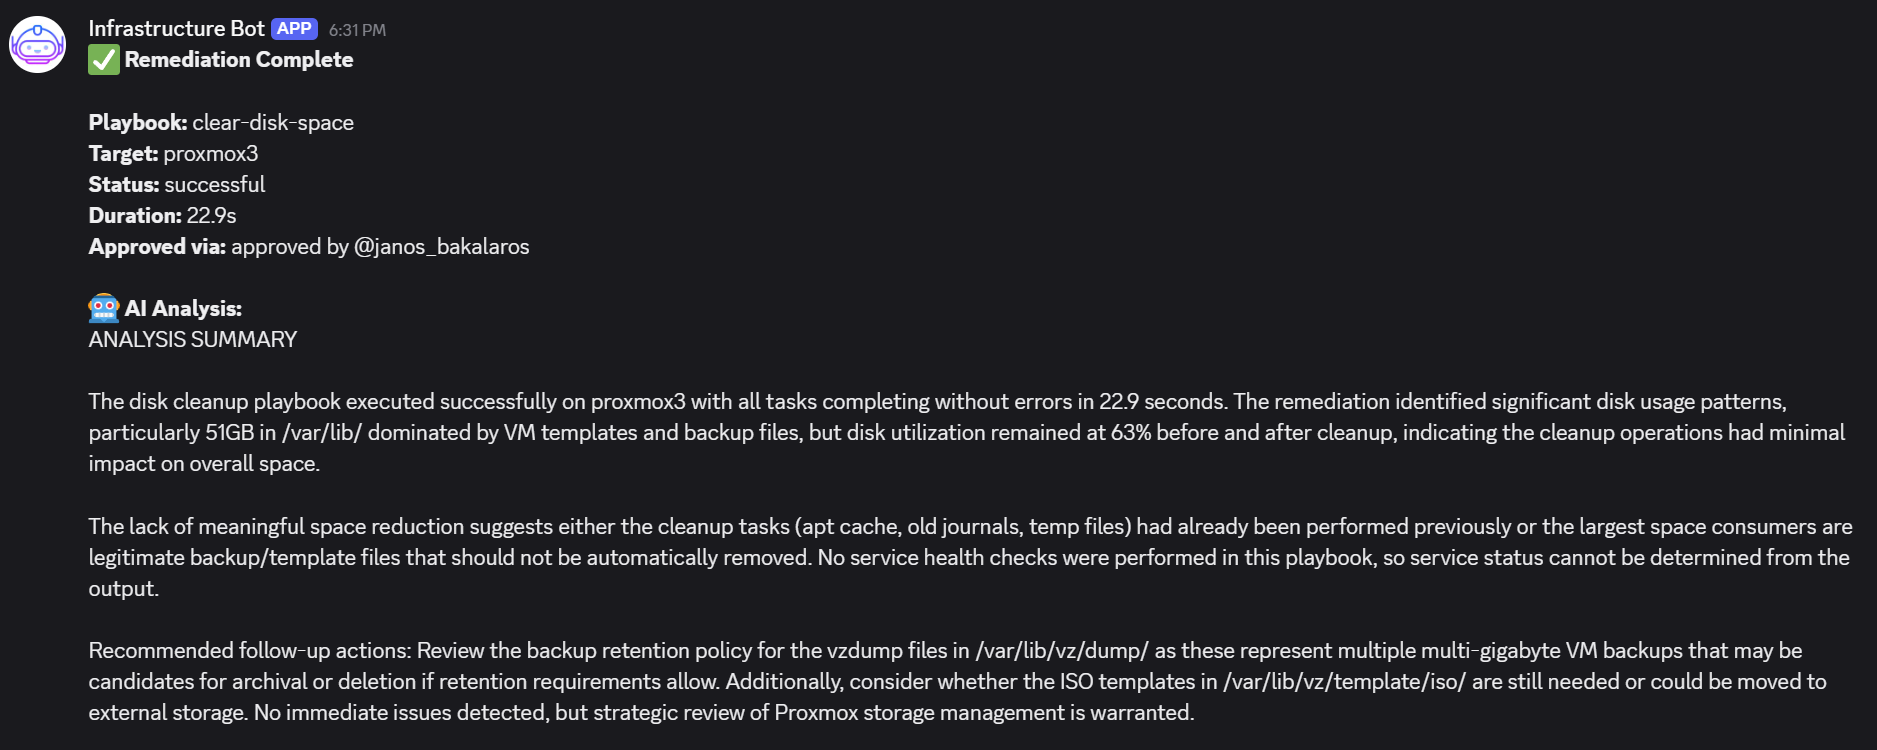
- In test 3, I temporarily lowered the threshold for disk space to get a Proxmox host flagged by the workflow. Due to a definition that any type 1 hypervisor operations are to be considered HIGH risk, AI made the correct judgement. If not approved within an hour, the remediation template would not get executed. I approved it to see what happens.
- The result in AWX revealed that not much could be removed:

- Our playbook is designed to only remove residual / temporary files, so if the host is filled with ISO images and backups, it would not really do much anyway, as can be seen below.
💡 Note
You can easily modify the ‘Message a Model’ node to fit your needs, define exceptions or even remove certain metrics from the Alloy agent monitoring to ensure that a mission critical host will never be affected by the workflow. I have put a placeholder in that node that any changes on a Type 1 hypervisor will be flagged as high risk. This worked during my testing phase but may benefit from more specific guidance and validation.
More tests could be conducted and I did run many in my environment. The three above demonstrate the functionality sufficiently. Now let’s look into what has not been covered in this tutorial from the security perspective and what are other desirable features that could be implemented.
8. Security & Functionality Considerations
This was quite an adventure! Some might like just the simpler advisory workflow, others the semi-autonomous handling of common issues that may occur in your infrastructure.
Adding additional playbooks
You can add your own remediation job into it easily. What needs to be done to make it happen?
- Create another playbook in your chosen automation platform.
- Add a variable in your Config to specify the template ID.
- Modify the prompt for Claude to take it into account.
- Modify the ‘Build Automation Platform Config’ node in n8n.
How Often To Trigger The Workflow?
The recommended period of time is every 15-30 minutes. Adjust the log polling period for Loki based on that (for example, if you run it every 15 minutes, then pull logs back in time only for that time period).
- What you want to prevent is a situation like this:
- Run the workflow every 15mins
- Logs from Loki look 60mins back
Such a setup may lead into issues where AI would be evaluating logs from the time before the issue was fixed and may end up suggesting the same kind of remediation it did previously even though the issue is already addressed.
💡 Note
For example, let's imagine a CPU spikes and a job is suggested (such as a host reboot). It works and a subsequent check 15mins later will not flag any issue, so there will be no need to pull logs from Loki. In the next cycle 15mins later, however, another issue occurs with an app consuming too much RAM. Since logs are pulled from 60mins ago, they could result in two suggested jobs, while only one is relevant at that point.
Security Considerations
Due to the length and focus of the article on delivering functionality, we have not looked more in details into the security aspect of the set up, esp. when preparing such a workflow for production. Authentication and HTTPS access has not been covered, yet it is essential for production-ready set ups. If you are considering using a workflow like this in production, consider the following standard security features:
- Reverse proxy with TLS for n8n (Caddy/nginx)
- Basic auth or OAuth2 proxy for Prometheus/Loki
- If you need to use external packages and thus use the
NODE_FUNCTION_ALLOW_EXTERNALdirective, please restrict it to only the required packages - Set
allowUnauthorizedCertstofalsein production and provide proper certificates (even if sources from OPNSense’s ACME service). - Deploy Fail2ban on the host running Docker containers
- Audit trail enhancement: The Discord messages provide a human-readable audit log, but for compliance, consider writing remediation events to a structured log (ELK/Loki) with timestamps, approvers, and outcomes.
- JSON Validation: While Claude's JSON responses are generally reliable, the
Parse Claude Responsewe are relying on the output from AI without validation. For production, consider adding a schema validation step (e.g., JSON Schema or Zod) before acting on AI output.
Other Functional Considerations
- Hostname interpretation: In the ‘Process Metrics’ node, the
stripDomainhelper splits on.which will truncate hostnames likeweb1.internalto justweb1. This is ok for as long as short hostnames are unique across the fleet. - Cache register: The advisory workflow uses
alert-cache-advisory.jsonwhile the remediation workflow usesalert-cache.json. This is on purpose to separate them. If you want to re-run a workflow and have the previously flagged hosts to be reported on again, simply remove the file by running a removal command, such assudo docker exec n8n rm /home/node/.n8n/alert-cache.json. - Alloy requirement (covered in Part 1): The process-level metrics (
top_cpu_processes,top_memory_processes) require theprocess-exporter/namedprocess-exporter. We have covered this in Part 1 of this series - in case you skipped to Part 2, then take it into account. - Execution timeout - In the past, n8n had a default timeout of 5 minutes, which would not be enough for some workflows. During my testing of version 2.6.3 and higher, a workflow ran even for several hours and was not terminated,.
Limitations / Out of scope
- No High Availability. This could be covered in the future if there is interest. So if the very VM host that runs these docker containers go down, you will not learn about issues. For this reason, it is always good to pair it up with a separate host running uptime monitoring, such as UptimeKuma or Zabbix.
- n8n supports PostgreSQL as a database backend and can run with multiple workers. For the monitoring stack, it is possible to run Prometheus in HA pair with Thanos or Mimir for long-term storage.
- No rollback functionality? For those who are more cautious, esp. in production use, before any changes are made to your infrastructure, you could always run a ‘take a snapshot’ playbook first before changes like reboots and disk space cleaning are implemented (unless those are bare metal hosts). The playbooks suggested in this tutorial are non-destructive:
- The disk cleaning job does not delete user data, only cache/temp/logs
- The process termination job uses TERM signal to allow for graceful shutdown
- The reboot host job captures pre and post-reboot events logs to keep an audit trail
- Rate limiting & local LLMs - in case you run the workflow several times in an hour and each time issues are found, you might incur additional charges when using public models like Claude. You might wish to consider a self-hosted LLMs like Qwen3-235B, Llama 4, Mistral Large 3, Phi-4 or even just an RPI 5 with a 5Stack LLM-8850 HAT (as the link reveals, you can install it with Qwen3:1.7b, Whisper and MeloTTS).
- Distro Limitations: Since I wrote this tutorial with Debian/Ubuntu in mind, other Linux distros (and UNIX) like RHEL and FreeBSD are not covered. You will need to adapt these as per your needs.
- Definition of exceptions: In the AI prompt, you could define a list of hosts that you simply do not want to touch. This could be your Type 1 hypervisors.
What’s Next - Part 3
- Fully Autonomous Workflow? In Part 3, I would like to look into providing even more autonomous access for AI to make informed decisions on infrastructure changes. We will need to employ some caution.
- Docker container remediation? One big topic that has been intentionally left out in Part 2 is the remediation of docker containers. For Docker environments, a
restart-container.ymlplaybook paired withcAdvisormetrics could extend this workflow to container-level remediation - something we will explore in Part 3. - Support for other distros? In addition, based on your comments below, we could look into automated jobs for other distros like FreeBSD and to pull logs from other systems like OPNSense. Everything is possible!
- Multi-step remediation approach? Lastly, what if more than one job needs to be executed? For example, metrics reveal an issue and you want to run a deeper diagnostic playbook before deciding on which action to take. A multi-step remediation approach may be required for such situation. The reason for not going there at this point is that I did not want to overload the readers with overly complicated workflows before the concept of AI-assisted remediation is properly laid out with the basic four templates.
Let me know what else you would like covered or what is missing in this series from your perspective. You can very much influence on where will things go next!
Enjoying this tutorial?
This site is a non-profit project. If it saved you some time, you can support it by getting Jan some coffee.
☕ Buy me a coffee
Comments