Part 1: Ultimate metrics & logs monitoring with visualization using Loki, Prometheus and Grafana
Part 1: Ultimate metrics & logs monitoring with visualization using Loki, Prometheus and Grafana
If you're managing more than a handful of servers, you already know the feeling: something breaks at 2 AM, and you're SSH-ing into machines one by one trying to figure out which host ran out of disk space or which service silently crashed three hours ago.
This tutorial addresses that. By the end of Part 1, you'll have a single dashboard showing CPU, RAM, disk usage and service health across every host in your infrastructure — whether that is 3 machines or 30.
We're deploying three services using Docker in a Proxmox VM (though any Debian host will work):
- Prometheus — collects resource metrics (CPU, RAM, disk, network) from all your hosts via the Grafana Alloy agent
- Loki — collects and indexes logs from every server's systemd journal and log files
- Grafana — visualizes everything in dashboards you can actually glance at and understand
We'll also use AWX (Ansible's web UI) to push the monitoring agent to your entire fleet in one click - you can use another automation platform of your choice, such as Semaphore UI.
What does the end result look like?
A single pane of glass where you can see, at a glance:
- Which hosts are healthy and which need attention
- RAM, CPU, and disk usage ranked by severity
- Service uptime status (MariaDB, Nginx, Docker, SSH, etc.)
- Full searchable logs from every host
What's in Part 2?
In the follow-up, we connect this monitoring stack to n8n and AI — so that when something goes wrong, you don't just get an alert, you get a diagnosis and recommended fix. We even let AI implement low-risk remediations automatically. But first, let's get the data flowing.
1. Prepare your VM
Assuming that you are using a vanilla Debian 13 image, we will need some packages:
su -
apt install sudo
usermod -aG sudo your_username
exit

# Log out and back in for sudo group to take effect
In case you would like to set up a custom SSH port, do the following after logging in again:
sudo nano /etc/ssh/sshd_config
# Find and uncomment + change to your preferred port number
Port 2222

# Save and exit the editor, restart SSH
sudo systemctl restart ssh
# Now you can connect to your custom port
At this point you could consider installing ufw or another local firewall. You would then need to ensure the ports that we mention below are opened.
Now let's install docker and other dependencies:
sudo apt update && sudo apt upgrade -y
sudo apt install -y curl wget git vim net-tools ca-certificates gnupg lsb-release

# Create a monitoring folder structure:
sudo mkdir -p /opt/monitoring/{data,config}
sudo mkdir -p /opt/monitoring/data/{prometheus,loki,grafana}
sudo chown -R $USER:$USER /opt/monitoring
If you use Ansible (or even AWX or Semaphore) for automation, remember to add your SSH key:
# 1. Create the 'ansible' user with no password.
# -m creates the /home/ansible directory.
# -s /bin/bash sets their shell.
sudo useradd -m -s /bin/bash ansible

# Lock the user - disable password-based login
sudo passwd -l ansible

# 2. Give the user passwordless sudo
sudo visudo
# Add this line at the very end of the file. Save and exit.
ansible ALL=(ALL) NOPASSWD: ALL

# 3. Create the .ssh directory and file as the 'ansible' user
sudo -u ansible mkdir /home/ansible/.ssh
sudo -u ansible chmod 700 /home/ansible/.ssh
sudo -u ansible touch /home/ansible/.ssh/authorized_keys
sudo -u ansible chmod 600 /home/ansible/.ssh/authorized_keys

# 4. Open the file and paste your key
sudo -u ansible nano /home/ansible/.ssh/authorized_keys
ssh-ed25519 your_pre-existing_key

# Paste the key from the clipboard. Save & exit.
Install Docker using the official Debian 13 method:
# Add Docker's official GPG key
sudo install -m 0755 -d /etc/apt/keyrings
curl -fsSL https://download.docker.com/linux/debian/gpg | sudo gpg --dearmor -o /etc/apt/keyrings/docker.gpg
sudo chmod a+r /etc/apt/keyrings/docker.gpg

# Add the repository
echo \
  "deb [arch=$(dpkg --print-architecture) signed-by=/etc/apt/keyrings/docker.gpg] https://download.docker.com/linux/debian \
  $(. /etc/os-release && echo "$VERSION_CODENAME") stable" | \
  sudo tee /etc/apt/sources.list.d/docker.list > /dev/null

# Install Docker
sudo apt update
sudo apt install -y docker-ce docker-ce-cli containerd.io docker-buildx-plugin docker-compose-plugin

# Add your user to docker group (so you do not need sudo for docker commands)
sudo usermod -aG docker $USER

# Log out and back in, then verify
docker --version
docker compose version
2. Configure Docker
Create your Docker compose file for the required containers:
nano /opt/monitoring/docker-compose.ymlservices:
prometheus:
image: prom/prometheus:latest
container_name: prometheus
restart: unless-stopped
ports:
- "9090:9090"
volumes:
- /opt/monitoring/config/prometheus.yml:/etc/prometheus/prometheus.yml:ro
- /opt/monitoring/data/prometheus:/prometheus
command:
- '--config.file=/etc/prometheus/prometheus.yml'
- '--storage.tsdb.path=/prometheus'
- '--storage.tsdb.retention.time=30d'
- '--web.enable-lifecycle'
- '--web.enable-remote-write-receiver' # Required for Alloy to work
networks:
- monitoring
loki:
image: grafana/loki:latest
container_name: loki
restart: unless-stopped
ports:
- "3100:3100"
volumes:
- /opt/monitoring/config/loki.yml:/etc/loki/local-config.yaml:ro
- /opt/monitoring/data/loki:/loki
command: -config.file=/etc/loki/local-config.yaml
networks:
- monitoring
grafana:
image: grafana/grafana:latest
container_name: grafana
restart: unless-stopped
ports:
- "3000:3000"
volumes:
- /opt/monitoring/data/grafana:/var/lib/grafana
- /opt/monitoring/config/grafana/provisioning:/etc/grafana/provisioning:ro
environment:
- GF_SECURITY_ADMIN_PASSWORD=changeme
- GF_SERVER_ROOT_URL=https://grafana.bachelor-tech.com
- GF_USERS_ALLOW_SIGN_UP=false
networks:
- monitoring
depends_on:
- prometheus
- loki
networks:
monitoring:
driver: bridge⚠️ Security note: By default, Prometheus, Loki, and Grafana run without authentication (aside from Grafana's admin password). If your monitoring server is accessible from untrusted networks, consider placing these services behind a reverse proxy with authentication, or binding them to localhost only and accessing via SSH tunnel.
Prometheus config
Now we can create the config for these containers. You can add some of your hosts manually to test the agent deployment later. We will handle their addition through AWX afterward.
nano /opt/monitoring/config/prometheus.ymlglobal:
scrape_interval: 15s
evaluation_interval: 15s
scrape_configs:
# Prometheus monitors itself
- job_name: 'prometheus'
static_configs:
- targets: ['localhost:9090']
# Node exporters - we'll populate this as we deploy them
# For now, just a placeholder structure
- job_name: 'node'
static_configs:
# Site 1
- targets:
- '192.168.16.76:9100' # A test host
labels:
site: 'site1'Loki configuration
Similarly, let's create a config file for Loki:
nano /opt/monitoring/config/loki.ymlauth_enabled: false
server:
http_listen_port: 3100
grpc_listen_port: 9096
common:
instance_addr: 127.0.0.1
path_prefix: /loki
storage:
filesystem:
chunks_directory: /loki/chunks
rules_directory: /loki/rules
replication_factor: 1
ring:
kvstore:
store: inmemory
query_range:
results_cache:
cache:
embedded_cache:
enabled: true
max_size_mb: 100
schema_config:
configs:
- from: 2020-10-24
store: tsdb
object_store: filesystem
schema: v13
index:
prefix: index_
period: 24h
ruler:
alertmanager_url: http://localhost:9093
limits_config:
retention_period: 30dGrafana provisioning
Create Grafana provisioning for data sources.
mkdir -p /opt/monitoring/config/grafana/provisioning/datasources
nano /opt/monitoring/config/grafana/provisioning/datasources/datasources.yml
apiVersion: 1
datasources:
- name: Prometheus
type: prometheus
access: proxy
url: http://prometheus:9090
isDefault: true
editable: false
- name: Loki
type: loki
access: proxy
url: http://loki:3100
editable: falseFix permissions for containers:
sudo chown -R 472:472 /opt/monitoring/data/grafana
sudo chown -R 65534:65534 /opt/monitoring/data/prometheus
sudo chown -R 10001:10001 /opt/monitoring/data/loki
Start it:
cd /opt/monitoring
sudo docker compose up -d
When launching it for the first time, the Docker images will be downloaded. Note: sudo is not needed for docker commands since your user was added to the docker group earlier. However, you must log out and back in first for the group change to take effect.

Verify that the containers are running and if they report any errors:
docker compose ps
docker compose logs -f
Increase Loki rate limits
Loki's default ingestion rate limits (4MB/s) can be too restrictive once you have many hosts reporting. Increase them to accommodate the volume of data from your fleet — without this, you may see rate-limiting errors once all agents are reporting:
nano /opt/monitoring/config/loki.yml

# Add these at the end of the file in 'limits_config:' section.
  ingestion_rate_mb: 16
  ingestion_burst_size_mb: 32
  per_stream_rate_limit: 5MB
  per_stream_rate_limit_burst: 15MB
Restart Loki to apply the changes:
docker compose restart lokiTest that you can reach the Web UIs:
- Grafana:
http://your-vm-ip:3000(admin / changeme) - Prometheus:
http://your-vm-ip:9090 - Loki:
http://your-vm-ip:3100/ready
Add your host into static mapping (Unbound DNS)
Assign a static IP to your host on your DHCP server. If on OPNSense, you can do so under Services → Kea DHCPv4 → Reservations.
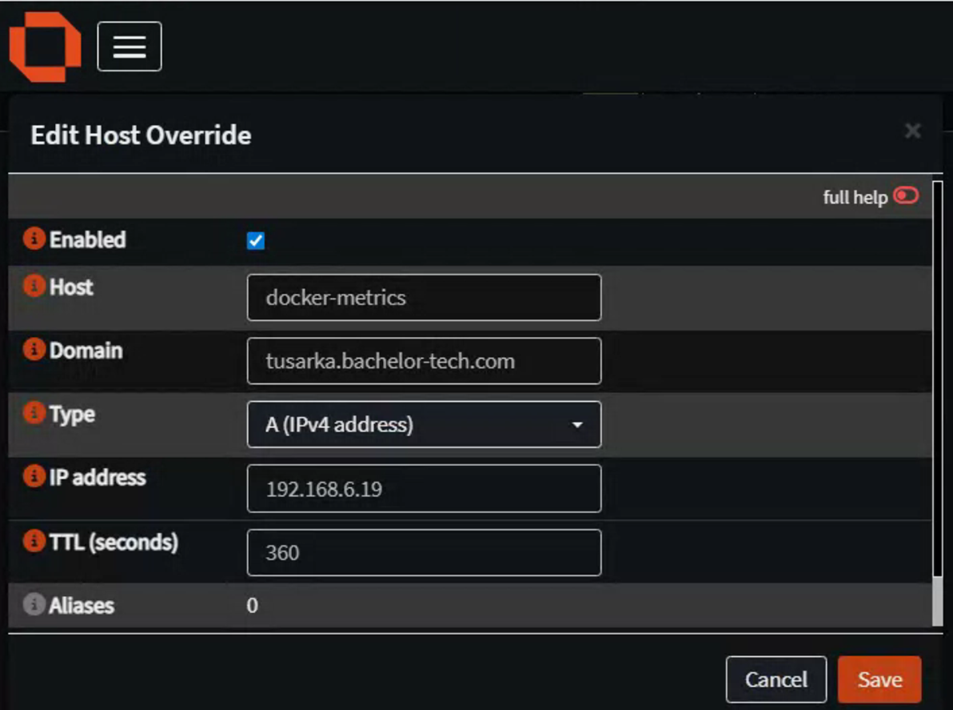
As Unbound DNS, go to Services → Unbound DNS → Overrides and add a new host:
- Host:
your_chosen_hostname - Domain:
yourdomain.tld - Type:
IPv4 - IP Address: your host's local IP address
Firewall considerations
If you're using OPNSense or another firewall across sites or subnets, ensure you have rules allowing traffic from your monitored hosts to the monitoring server on:
- Port 9090 — Prometheus remote write endpoint
- Port 3100 — Loki log push endpoint
- Port 3000 — Grafana web UI (if accessed remotely)
In the next step, we will set up an agent on one host to test connectivity and then create an AWX playbook to deploy this agent to all hosts.
3. Deploy Alloy to one host
Until recently, to collect OS-level metrics as well as system logs, two agents were commonly used, such as node_exporter and promtail. However, promtail has recently entered long-term support with no active development (see their Github repo). Instead, they suggest to use Alloy.
- For those who have been using promtail and this change catches them by surprise, see more info on SUSE blog from December 2025.
- As explained on Github,
Alloyis an 'open source OpenTelemetry Collector distribution with built-in Prometheus pipelines and support for metrics, logs, traces, and profiles'. Therefore, it collects both types of logs while still maintaining connectivity with existing Prometheus and Loki backends. - The one difference with Alloy is that it pushes data to Prometheus (rather than Prometheus pulling it), so a remote write receiver has to be enabled in the Docker (this was done already in the previous step).
Manually deploy on one host
Before we deploy it 'en masse' to all hosts, pick one of your choice and let's test that the connection works. If it works, we will then transfer it into an Ansible playbook.
Note: Replace
YOUR_MONITORING_SERVER_IP,YOUR_HOSTNAME, andYOUR_SITEwith your actual values in the config below.
# Download the binary
cd /tmp
curl -LO https://github.com/grafana/alloy/releases/download/v1.8.2/alloy-linux-amd64.zip
unzip alloy-linux-amd64.zip

# Install Alloy
sudo mv alloy-linux-amd64 /usr/local/bin/alloy
sudo chmod +x /usr/local/bin/alloy

# Create config directory
sudo mkdir -p /etc/alloy

# Create config file
sudo tee /etc/alloy/config.alloy > /dev/null <<'EOF'
// ============================================
//     METRICS: System metrics collection
// ============================================

prometheus.exporter.unix "local" {
  enable_collectors = ["cpu", "diskstats", "filesystem", "loadavg", "meminfo", "netdev", "systemd", "pressure"]
  systemd {
    enable_restarts = true
    unit_include = "(mariadb|mysql|nginx|apache2|docker|sshd|alloy|proxmox-backup-proxy|pveproxy|pvedaemon|corosync|gitea|postfix|dovecot|fail2ban|syncthing@.*)\\.service"
  }
}

prometheus.exporter.process "default" {
  matcher {
    name    = "{{.Comm}}"
    cmdline = [".+"]
  }
}

discovery.relabel "unix" {
  targets = prometheus.exporter.unix.local.targets

  rule {
    target_label = "instance"
    replacement  = "YOUR_HOSTNAME"
  }
}

discovery.relabel "process" {
  targets = prometheus.exporter.process.default.targets

  rule {
    target_label = "instance"
    replacement  = "YOUR_HOSTNAME"
  }
}

prometheus.scrape "unix" {
  targets         = discovery.relabel.unix.output
  forward_to      = [prometheus.remote_write.default.receiver]
  scrape_interval = "30s"
  job_name        = "integrations/unix"
}

prometheus.scrape "process" {
  targets         = discovery.relabel.process.output
  forward_to      = [prometheus.remote_write.default.receiver]
  scrape_interval = "30s"
  job_name        = "integrations/process"
}

// ============================================
//     REMOTE WRITE: Push metrics to Prometheus
// ============================================

prometheus.remote_write "default" {
  endpoint {
    url = "http://YOUR_MONITORING_SERVER_IP:9090/api/v1/write"
  }
  external_labels = {
    host = "YOUR_HOSTNAME",
    site = "YOUR_SITE",
  }
}

// ============================================
//     LOGS: Systemd journal collection
// ============================================

loki.source.journal "systemd" {
  forward_to    = [loki.process.add_labels.receiver]
  relabel_rules = loki.relabel.journal.rules
  labels        = { job = "systemd-journal" }
}

loki.relabel "journal" {
  forward_to = []
  rule {
    source_labels = ["__journal__systemd_unit"]
    target_label  = "unit"
  }
  rule {
    source_labels = ["__journal_priority_keyword"]
    target_label  = "level"
  }
}

// ============================================
//     LOGS: File-based log collection
// ============================================

loki.source.file "varlogs" {
  targets    = [
    { __path__ = "/var/log/*.log", job = "varlogs" },
    { __path__ = "/var/log/**/*.log", job = "varlogs" },
  ]
  forward_to = [loki.process.add_labels.receiver]
}

// ============================================
//     LOGS: Label enrichment + push to Loki
// ============================================

loki.process "add_labels" {
  forward_to = [loki.write.default.receiver]
  stage.static_labels {
    values = {
      host     = "YOUR_HOSTNAME",
      instance = "YOUR_HOSTNAME",
      site     = "YOUR_SITE",
    }
  }
}

loki.write "default" {
  endpoint {
    url = "http://YOUR_MONITORING_SERVER_IP:3100/loki/api/v1/push"
  }
}
EOF

# Create systemd service
sudo tee /etc/systemd/system/alloy.service > /dev/null <<EOF
[Unit]
Description=Grafana Alloy
After=network.target

[Service]
Type=simple
ExecStart=/usr/local/bin/alloy run /etc/alloy/config.alloy --storage.path=/var/lib/alloy
Restart=always
RestartSec=5

[Install]
WantedBy=multi-user.target
EOF

# Create storage directory
sudo mkdir -p /var/lib/alloy

# Start it
sudo systemctl daemon-reload
sudo systemctl enable --now alloy

# Verify
sudo systemctl status alloy
Watch the logs to see if there are any errors (see the troubleshooting section below if you find any).
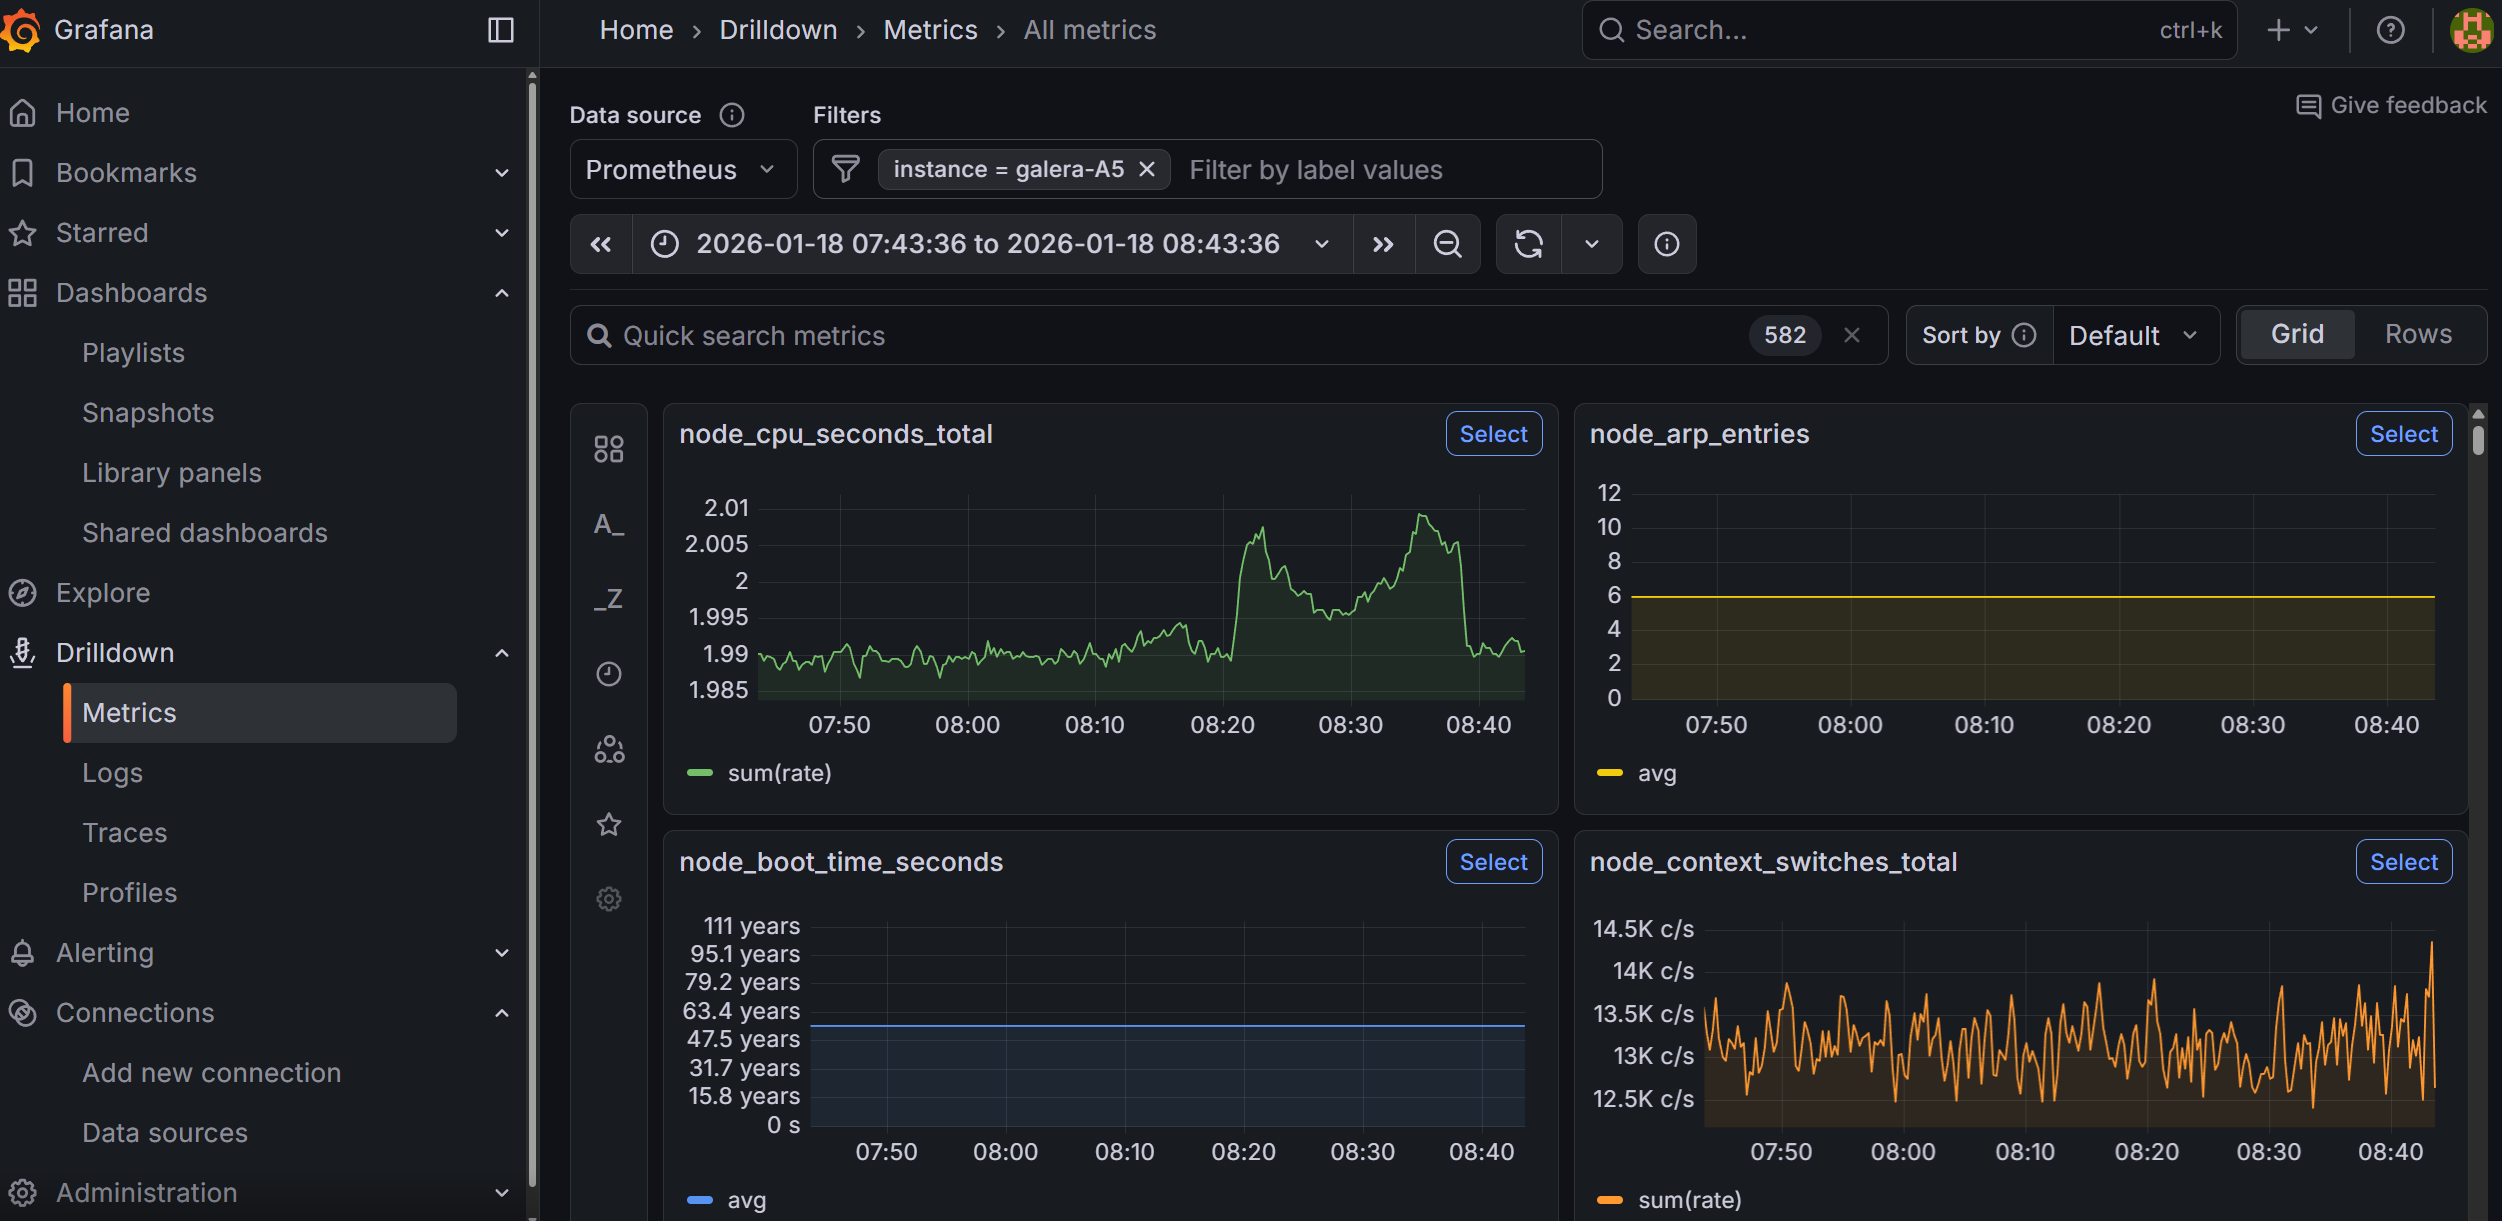
If all goes well, you will be able to go to Grafana under Drilldown → Metrics, and manually type instance (press enter), followed by selecting the = (equal sign) and then type your hostname. This will show graphs related to the host that you have installed the Alloy agent on.
Alternatively, you can also go to 'Explore' and build your query there from the available options. For example, you can look at available RAM for your host using the node_memory_MemAvailable_bytes parameter. If you prefer to store and copy paste your queries, you can click on the 'Code' button (instead of using the 'Builder' and enter the full query) and then click on the blue button to run the query:
# Memory available on your host
node_memory_MemAvailable_bytes{instance="your_hostname"}

# CPU usage (all cores)
node_cpu_seconds_total{instance="your_hostname"}

# Disk space free
node_filesystem_avail_bytes{instance="your_hostname"}

# All metrics from your host
{instance="your_hostname"}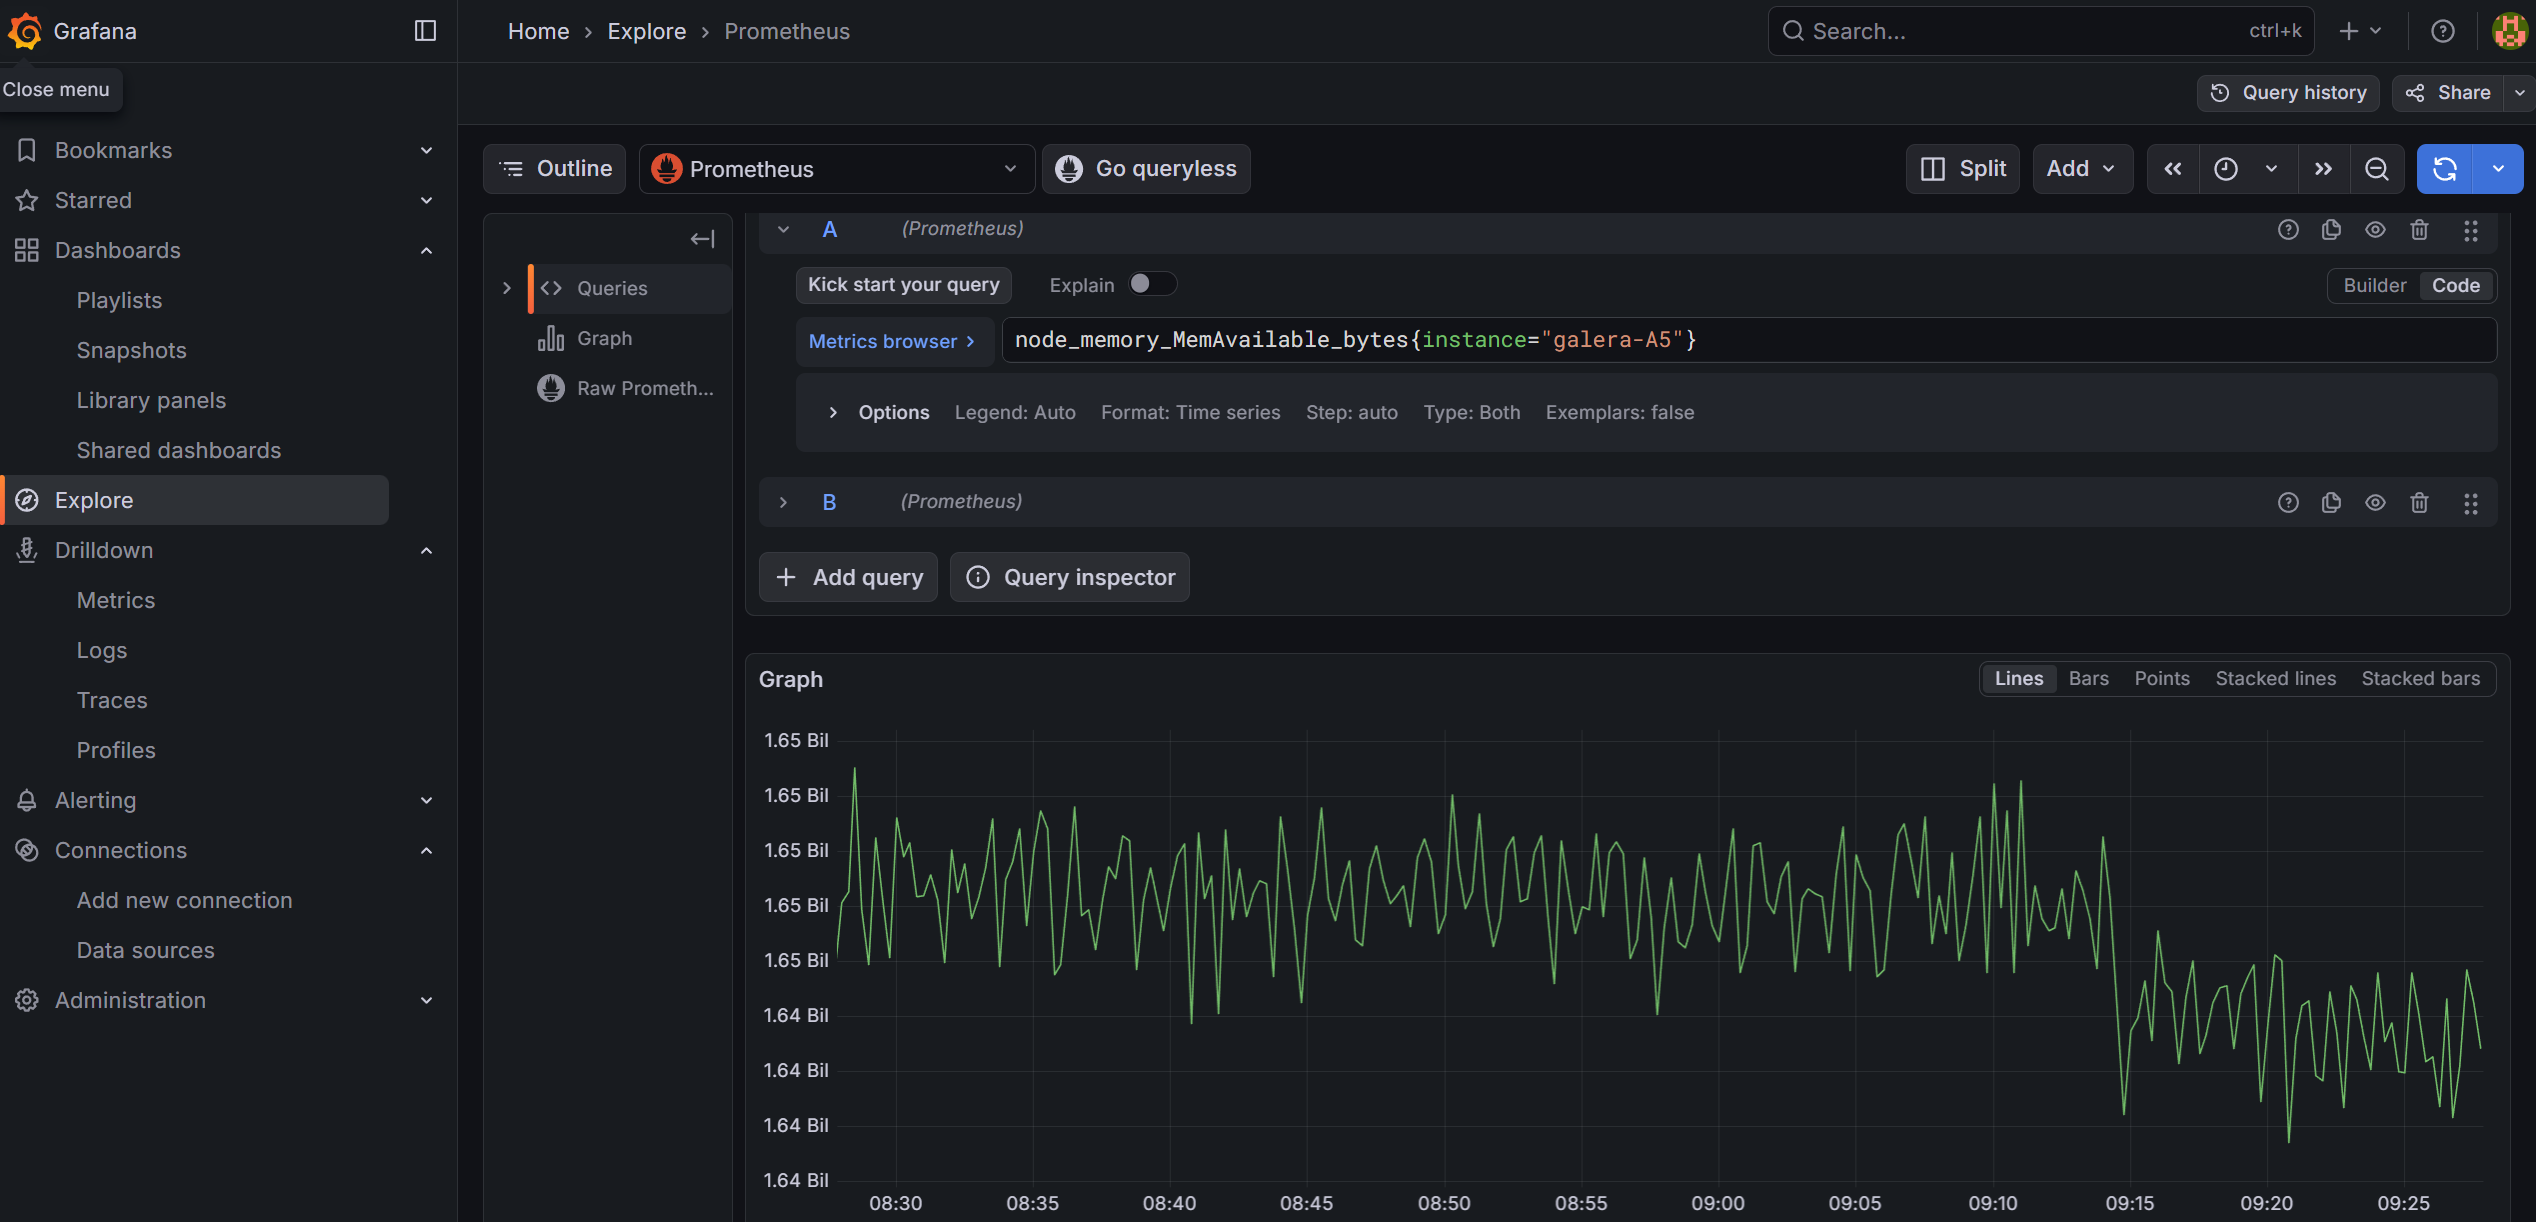
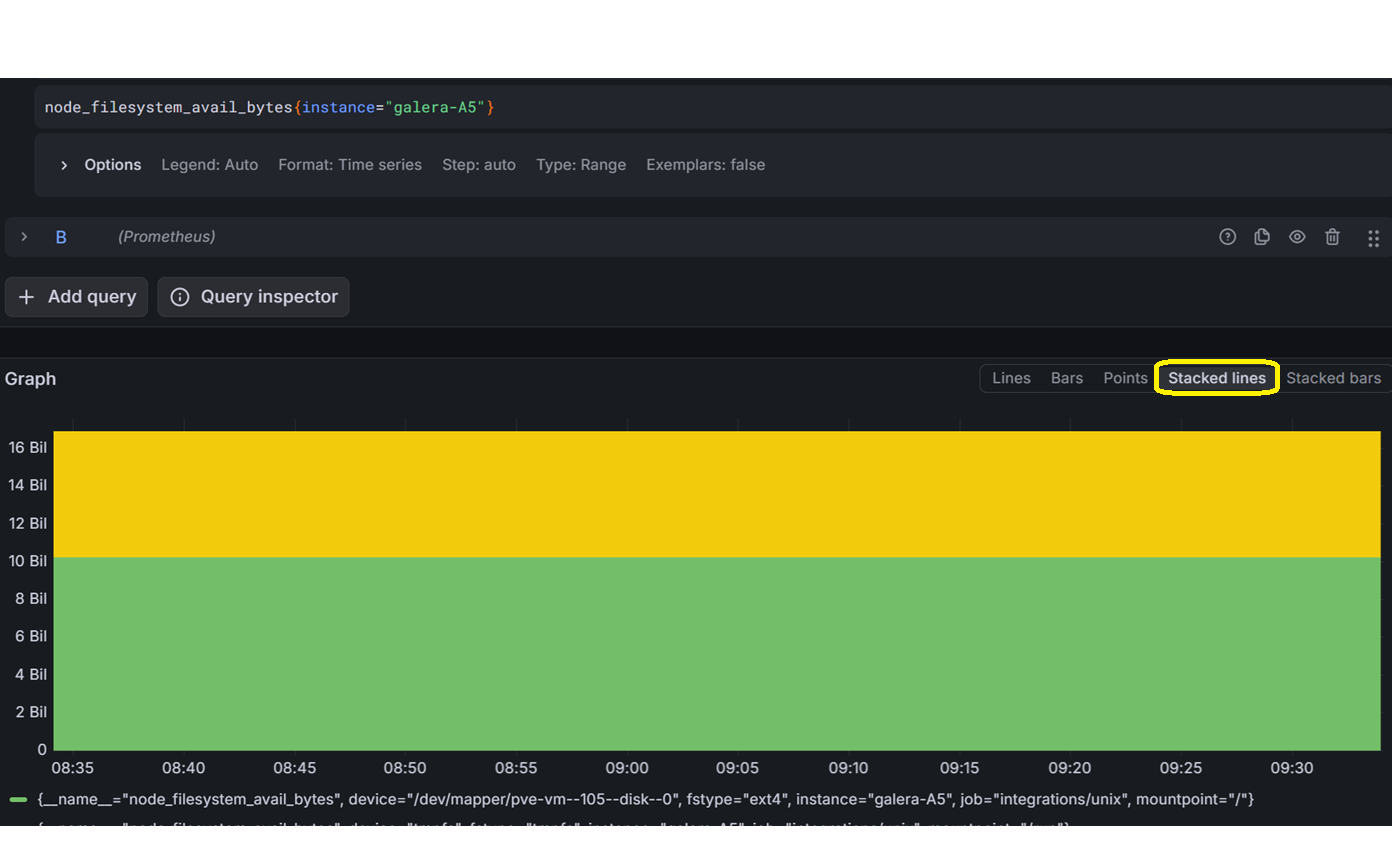
For queries such as those related to drive space available versus used, you can change the graph style to 'Stacked lines'. I recommend you to play around in Grafana for a while.
Troubleshooting connectivity with Alloy
Issue 1: Alloy service not starting or reporting errors
Check the logs first:
sudo journalctl -u alloy -f --no-pagerCommon causes:
-
Config syntax errors: Alloy's River syntax is strict. Run a syntax check:
/usr/local/bin/alloy fmt /etc/alloy/config.alloyIf it reformats without errors, the syntax is valid.
-
Permission denied: Alloy needs read access to
/var/log/files and the systemd journal. If running as a non-root user, ensure it has thesystemd-journalandadmgroups:sudo usermod -aG systemd-journal alloy sudo usermod -aG adm alloy -
Port already in use: Alloy's default HTTP debug UI runs on port 12345. If another service uses it, add
-server.http.listen-addr=0.0.0.0:12346to the ExecStart line in the systemd unit file. -
Storage path doesn't exist: Ensure
/var/lib/alloyexists and is writable.
Issue 2: Nothing appearing in Grafana
Explore Prometheus without Grafana. In the query box, try the following commands to see if it sees the host data:
# Any Unix-based hosts
{job="integrations/unix"}

# Summary of available memory for Unix hosts:
node_memory_MemAvailable_bytes{job="integrations/unix"}

# CPU info for a specific host:
node_cpu_seconds_total{instance="your_host"}
Issue 3: No data flowing to Loki
Check if logs are arriving. From the Docker host, run the following:
curl -s "http://your_docker_host_ip:3100/loki/api/v1/labels"If you see labels like host, job, unit, then logs are arriving. If empty, check:
- Alloy logs for Loki push errors
- Firewall rules between the host and the monitoring server on port 3100
Issue 4: Alloy is running but Prometheus shows no data
Verify the remote write endpoint is reachable from the host:
curl -s -o /dev/null -w "%{http_code}" http://your_monitoring_server:9090/api/v1/writeA 204 response means the endpoint is accepting writes. A connection timeout means a firewall or routing issue.
Issue 5: Firewall blocking connections
If using OPNSense, ensure you have firewall rules allowing traffic from your monitored hosts to the monitoring server on ports 9090 (Prometheus), 3100 (Loki), and 3000 (Grafana).
Issue 6: Labels are missing or incorrect in Grafana
If instance, site, or host labels aren't appearing:
- Check the Alloy config on the affected host:
cat /etc/alloy/config.alloy - Verify the
external_labelsblock inprometheus.remote_writeand thestage.static_labelsblock inloki.process - After fixing, restart:
sudo systemctl restart alloy
4. Create a playbook to push Alloy to all hosts
While you could tackle it manually, if you have AWX (or Semaphore or pure Ansible) deployed in your home lab, you can create a playbook and tackle it for all your hosts, which is very elegant and future-proof.
- If you do not have such an automation in place and you find it interesting, why don't you set up AWX using my previous guide? See Deploy Ansible AWX to automate OS patching.
- For AWX, you will need space for source control in your own repo. I'm using a locally hosted Gitea.
Playbook structure
Here is the structure of the repo. This structure follows standard Ansible best practices for role-based playbooks. It may feel like a lot of files/folders, yet each has a slightly different role and is kept as short as possible, so do not feel discouraged. Rather, let's dive into each.
alloy-deploy/
├── playbook.yml
├── inventory/
│   └── group_vars/
│       └── all.yml
├── roles/
│   └── alloy/
│       ├── tasks/
│       │   └── main.yml
│       ├── templates/
│       │   └── config.alloy.j2
│       ├── handlers/
│       │   └── main.yml
│       └── files/
│           └── alloy.service
Initial playbook
In this playbook, we confirm the OS family of the host that is being processed.
- If it is the one(s) we want, the 'alloy' role is assumed and additional scripts are triggered in the
/roles/alloy/folder. - If it is not the supported OS architecture, then the playbook reports it and does not proceed further for the given host.
- Replace the
monitoring_serverIP with the IP of your VM on which you installed the Docker containers.
# playbook.yml

---
- name: Deploy Grafana Alloy monitoring agent
  hosts: all
  become: true
  vars:
    monitoring_server: "1.2.3.4"
    alloy_version: "1.8.2"

  pre_tasks:
    - name: Gather OS facts if not already present
      ansible.builtin.setup:
        gather_subset:
          - '!all'
          - os_family
      when: ansible_os_family is not defined

    - name: Check if host is supported
      ansible.builtin.set_fact:
        alloy_supported: "{{ ansible_os_family == 'Debian' and 'no_monitoring' not in group_names }}"

    - name: Skip unsupported or excluded hosts
      ansible.builtin.debug:
        msg: >-
          Skipping {{ inventory_hostname }} -
          {% if 'no_monitoring' in group_names %}excluded via no_monitoring group
          {% else %}OS family {{ ansible_os_family }} not supported{% endif %}
      when: not alloy_supported

  roles:
    - role: alloy
      when: alloy_supported
The main task
After the pre-check is passed, the main playbook is triggered.
- The variable
host_siteis defined based on group membership - if you do not have those defined, either remove this task or modify it to your liking. - The playbook verifies that an installation of the agent is even needed and if yes, it is downloaded, unzipped, installed, permissions set and Alloy is added to
systemdto be managed as a service (daemon) and to start at boot time. Lastly, the downloaded zipped binary and extracted data are deleted.
# roles/alloy/tasks/main.yml

---
- name: Check if Alloy is already installed
  ansible.builtin.stat:
    path: /usr/local/bin/alloy
  register: alloy_binary

- name: Get installed Alloy version
  ansible.builtin.command: /usr/local/bin/alloy --version
  register: alloy_installed_version
  changed_when: false
  failed_when: false
  when: alloy_binary.stat.exists

- name: Set install required fact
  ansible.builtin.set_fact:
    alloy_install_required: "{{ not alloy_binary.stat.exists or (alloy_version not in (alloy_installed_version.stdout | default(''))) }}"

- name: Install dependencies
  ansible.builtin.apt:
    name:
      - unzip
      - curl
    state: present
    update_cache: true
  when: alloy_install_required

- name: Download Alloy
  ansible.builtin.get_url:
    url: "https://github.com/grafana/alloy/releases/download/v{{ alloy_version }}/alloy-linux-amd64.zip"
    dest: "/tmp/alloy-linux-amd64.zip"
    mode: '0644'
  when: alloy_install_required

- name: Extract Alloy binary
  ansible.builtin.unarchive:
    src: "/tmp/alloy-linux-amd64.zip"
    dest: "/tmp/"
    remote_src: true
  when: alloy_install_required

- name: Install Alloy binary
  ansible.builtin.copy:
    src: "/tmp/alloy-linux-amd64"
    dest: "/usr/local/bin/alloy"
    mode: '0755'
    remote_src: true
  when: alloy_install_required
  notify: Restart Alloy

- name: Create config directory
  ansible.builtin.file:
    path: /etc/alloy
    state: directory
    mode: '0755'

- name: Create data directory
  ansible.builtin.file:
    path: /var/lib/alloy
    state: directory
    mode: '0755'

- name: Determine site from group membership
  ansible.builtin.set_fact:
    host_site: >-
      {%- if 'site1' in group_names -%}site1
      {%- elif 'site3' in group_names -%}site2
      {%- elif 'site3' in group_names -%}site3
      {%- else -%}unknown
      {%- endif -%}

- name: Deploy Alloy configuration
  ansible.builtin.template:
    src: config.alloy.j2
    dest: /etc/alloy/config.alloy
    mode: '0644'
  notify: Restart Alloy

- name: Deploy systemd service
  ansible.builtin.copy:
    src: alloy.service
    dest: /etc/systemd/system/alloy.service
    mode: '0644'
  notify:
    - Reload systemd
    - Restart Alloy

- name: Enable and start Alloy
  ansible.builtin.systemd:
    name: alloy
    enabled: true
    state: started
    daemon_reload: true

- name: Clean up downloaded files
  ansible.builtin.file:
    path: "{{ item }}"
    state: absent
  loop:
    - /tmp/alloy-linux-amd64.zip
    - /tmp/alloy-linux-amd64
  when: alloy_install_required
Deploy config file for alloy
Apart from the installation of Alloy for each host, we will also want to deploy a config file so that it knows about where the Prometheus server is and what hostname should Loki use (which we take from the actual hostname in Ansible).
Apart from a variable called host_site defined in the previous template, there is another variable expected to be present for you to have defined for each host:
ansible_host— either the IP or the FQDN
If you do not have it defined, check out my previous tutorial or try adding it or adjusting the script below, whatever works for you 😇
Feel free to add/remove services as you need per your own environment.
See below for the content of the config.alloy.j2 file:
// Grafana Alloy Configuration
// Managed by Ansible - do not edit manually
// Host: {{ ansible_host }}
// Site: {{ host_site }}

prometheus.exporter.unix "local" {
  enable_collectors = ["cpu", "diskstats", "filesystem", "loadavg", "meminfo", "netdev", "systemd", "pressure"]
  systemd {
    enable_restarts = true
    unit_include = "(mariadb|mysql|nginx|apache2|docker|sshd|alloy|proxmox-backup-proxy|pveproxy|pvedaemon|corosync|gitea|postfix|dovecot|fail2ban|syncthing@.*)\\.service"
  }
}

prometheus.exporter.process "default" {
  matcher {
{% raw %}
    name    = "{{.Comm}}"
{% endraw %}
    cmdline = [".+"]
  }
}

discovery.relabel "unix" {
  targets = prometheus.exporter.unix.local.targets

  rule {
    target_label = "instance"
    replacement  = "{{ ansible_host.split('.')[0] }}"
  }
}

discovery.relabel "process" {
  targets = prometheus.exporter.process.default.targets

  rule {
    target_label = "instance"
    replacement  = "{{ ansible_host.split('.')[0] }}"
  }
}

prometheus.scrape "unix" {
  targets         = discovery.relabel.unix.output
  forward_to      = [prometheus.remote_write.default.receiver]
  scrape_interval = "30s"
  job_name        = "integrations/unix"
}

prometheus.scrape "process" {
  targets         = discovery.relabel.process.output
  forward_to      = [prometheus.remote_write.default.receiver]
  scrape_interval = "30s"
  job_name        = "integrations/process"
}

{% if 'docker' in group_names %}
prometheus.exporter.cadvisor "docker" {
  docker_host = "unix:///var/run/docker.sock"
  docker_only = true
}

discovery.relabel "docker" {
  targets = prometheus.exporter.cadvisor.docker.targets

  rule {
    target_label = "instance"
    replacement  = "{{ ansible_host.split('.')[0] }}"
  }
}

prometheus.scrape "docker" {
  targets         = discovery.relabel.docker.output
  forward_to      = [prometheus.remote_write.default.receiver]
  scrape_interval = "30s"
  job_name        = "integrations/docker"
}
{% endif %}

prometheus.remote_write "default" {
  endpoint {
    url = "http://{{ monitoring_server }}:9090/api/v1/write"
  }
  external_labels = {
    host = "{{ ansible_host }}",
    site = "{{ host_site }}",
  }
}

loki.source.journal "systemd" {
  forward_to    = [loki.process.add_labels.receiver]
  relabel_rules = loki.relabel.journal.rules
  labels        = { job = "systemd-journal" }
}

loki.relabel "journal" {
  forward_to = []
  rule {
    source_labels = ["__journal__systemd_unit"]
    target_label  = "unit"
  }
  rule {
    source_labels = ["__journal_priority_keyword"]
    target_label  = "level"
  }
}

loki.source.file "varlogs" {
  targets    = [
    { __path__ = "/var/log/*.log", job = "varlogs" },
    { __path__ = "/var/log/**/*.log", job = "varlogs" },
  ]
  forward_to = [loki.process.add_labels.receiver]
}

loki.process "add_labels" {
  forward_to = [loki.write.default.receiver]
  stage.static_labels {
    values = {
      host     = "{{ ansible_host }}",
      instance = "{{ ansible_host.split('.')[0] }}",
      site     = "{{ host_site }}",
    }
  }
}

loki.write "default" {
  endpoint {
    url = "http://{{ monitoring_server }}:3100/loki/api/v1/push"
  }
}
Systemd unit file for Alloy
The content of the alloy.service file used for systemd:
# roles/alloy/files/alloy.service

[Unit]
Description=Grafana Alloy
After=network.target

[Service]
Type=simple
ExecStart=/usr/local/bin/alloy run /etc/alloy/config.alloy --storage.path=/var/lib/alloy
Restart=always
RestartSec=5

[Install]
WantedBy=multi-user.target
Service restart handlers
This short playbook handles the reloading of the systemd daemon and the restarting of the alloy service after Alloy is installed.
# roles/alloy/handlers/main.yml

---
- name: Reload systemd
  ansible.builtin.systemd:
    daemon_reload: true

- name: Restart Alloy
  ansible.builtin.systemd:
    name: alloy
    state: restarted
Docker Monitoring server info
This is optional but recommended — these are default variables shared across all hosts (monitoring server IP, Alloy agent version).
# inventory/group_vars/all.yml

---
monitoring_server: "your_actual_vm_ip"
alloy_version: "1.8.2" # Replace this with your current version
Sync Playbook and add a template
Once all the files are uploaded to your preferred source version control software, go to Projects and click on the sync button to sync the newest addition with your AWX instance.
Then head to Templates → Add button → Add job template.
- Name: Deploy Alloy agent
- Inventory: your inventory - best to have it all under one unified one with all sites
- Project: Your source version controlled repo
- Execution Environment: your preferred EE that has at least the
ansible.netcommonlibrary. See more info on how to set up your own EE. - Playbook: Choose the playbook we created above
- Credentials: All your hosts need to be reachable via SSH, choose a credential
- Tick the box for Privilege Escalation

Run the job on just one or a few hosts before running it on the whole fleet. Then watch and enjoy 😇
Ensure data is flowing to Grafana
Let's confirm that the data is actually present in Grafana.
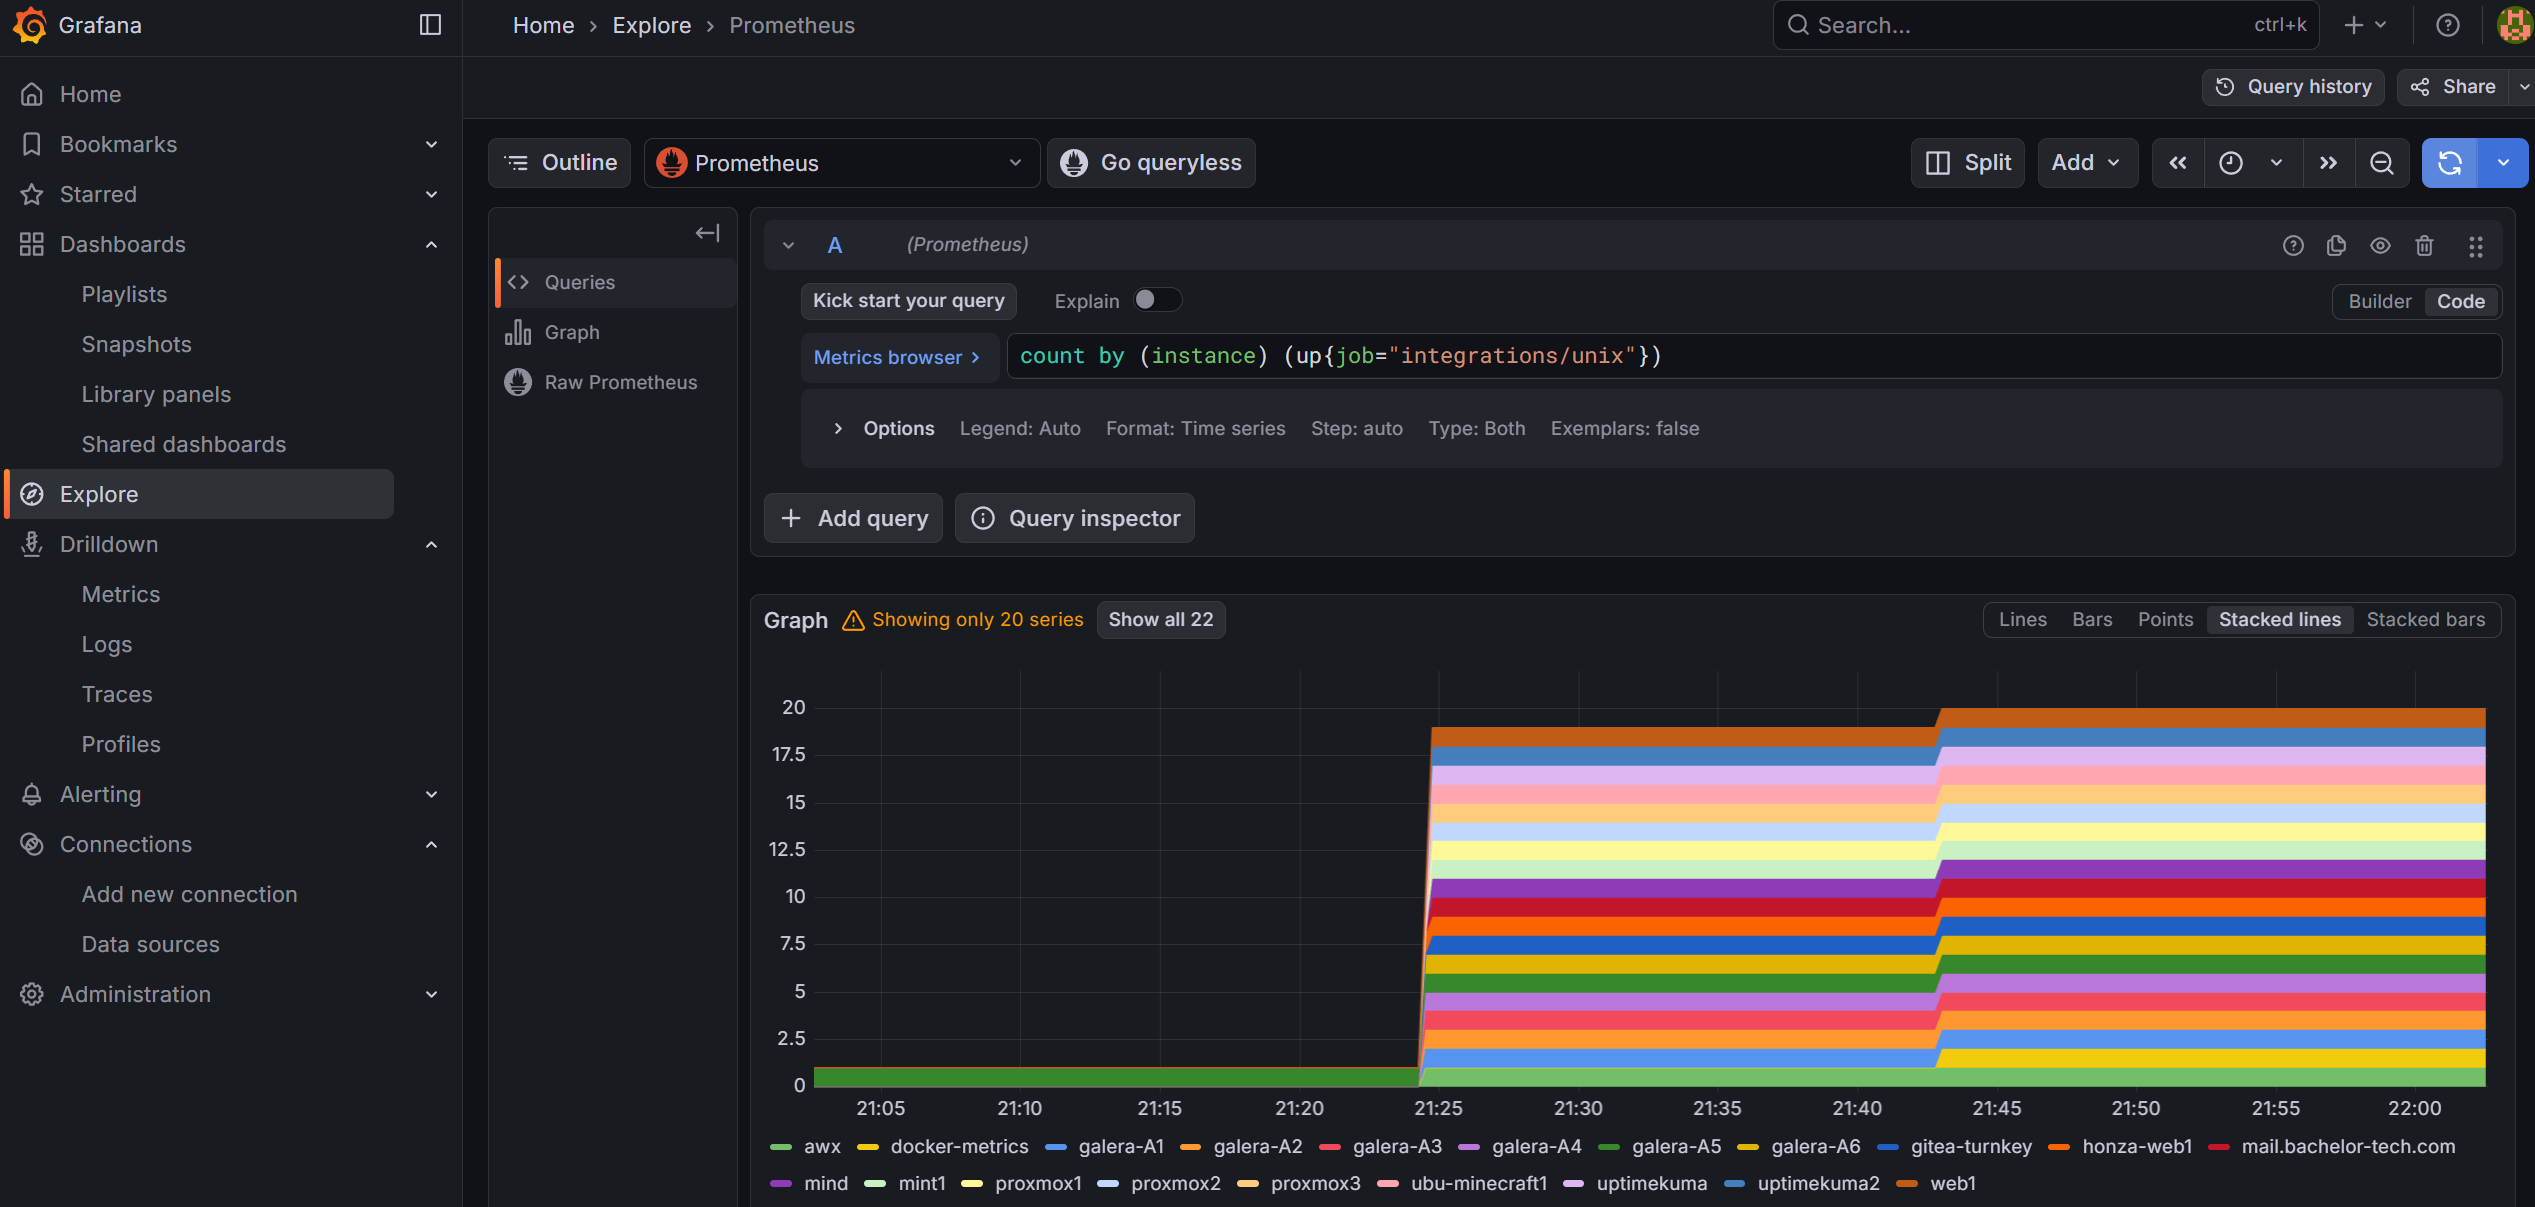
Go to Explore → select Prometheus → run this query (use the 'code' view to just copy paste the command below):
count by (instance) (up{job="integrations/unix"})The result should not surprise you - based on the number of successful completions in AWX:
With hosts being added, we can now consider customizing our dashboard to see what we want to see.
5. Customize Grafana
One thing is to get all the data into Grafana. The other is to ensure that you can visualize the data it gathers in one glance.
- Go to Dashboards → on the right side, click on the dropdown button and select New → Import.
- Under 'Find and import dashboards for common applications', enter ID:
1860(Node Exporter Full) - Click on the Load button
- Select your Prometheus data source
- Click on the Import button

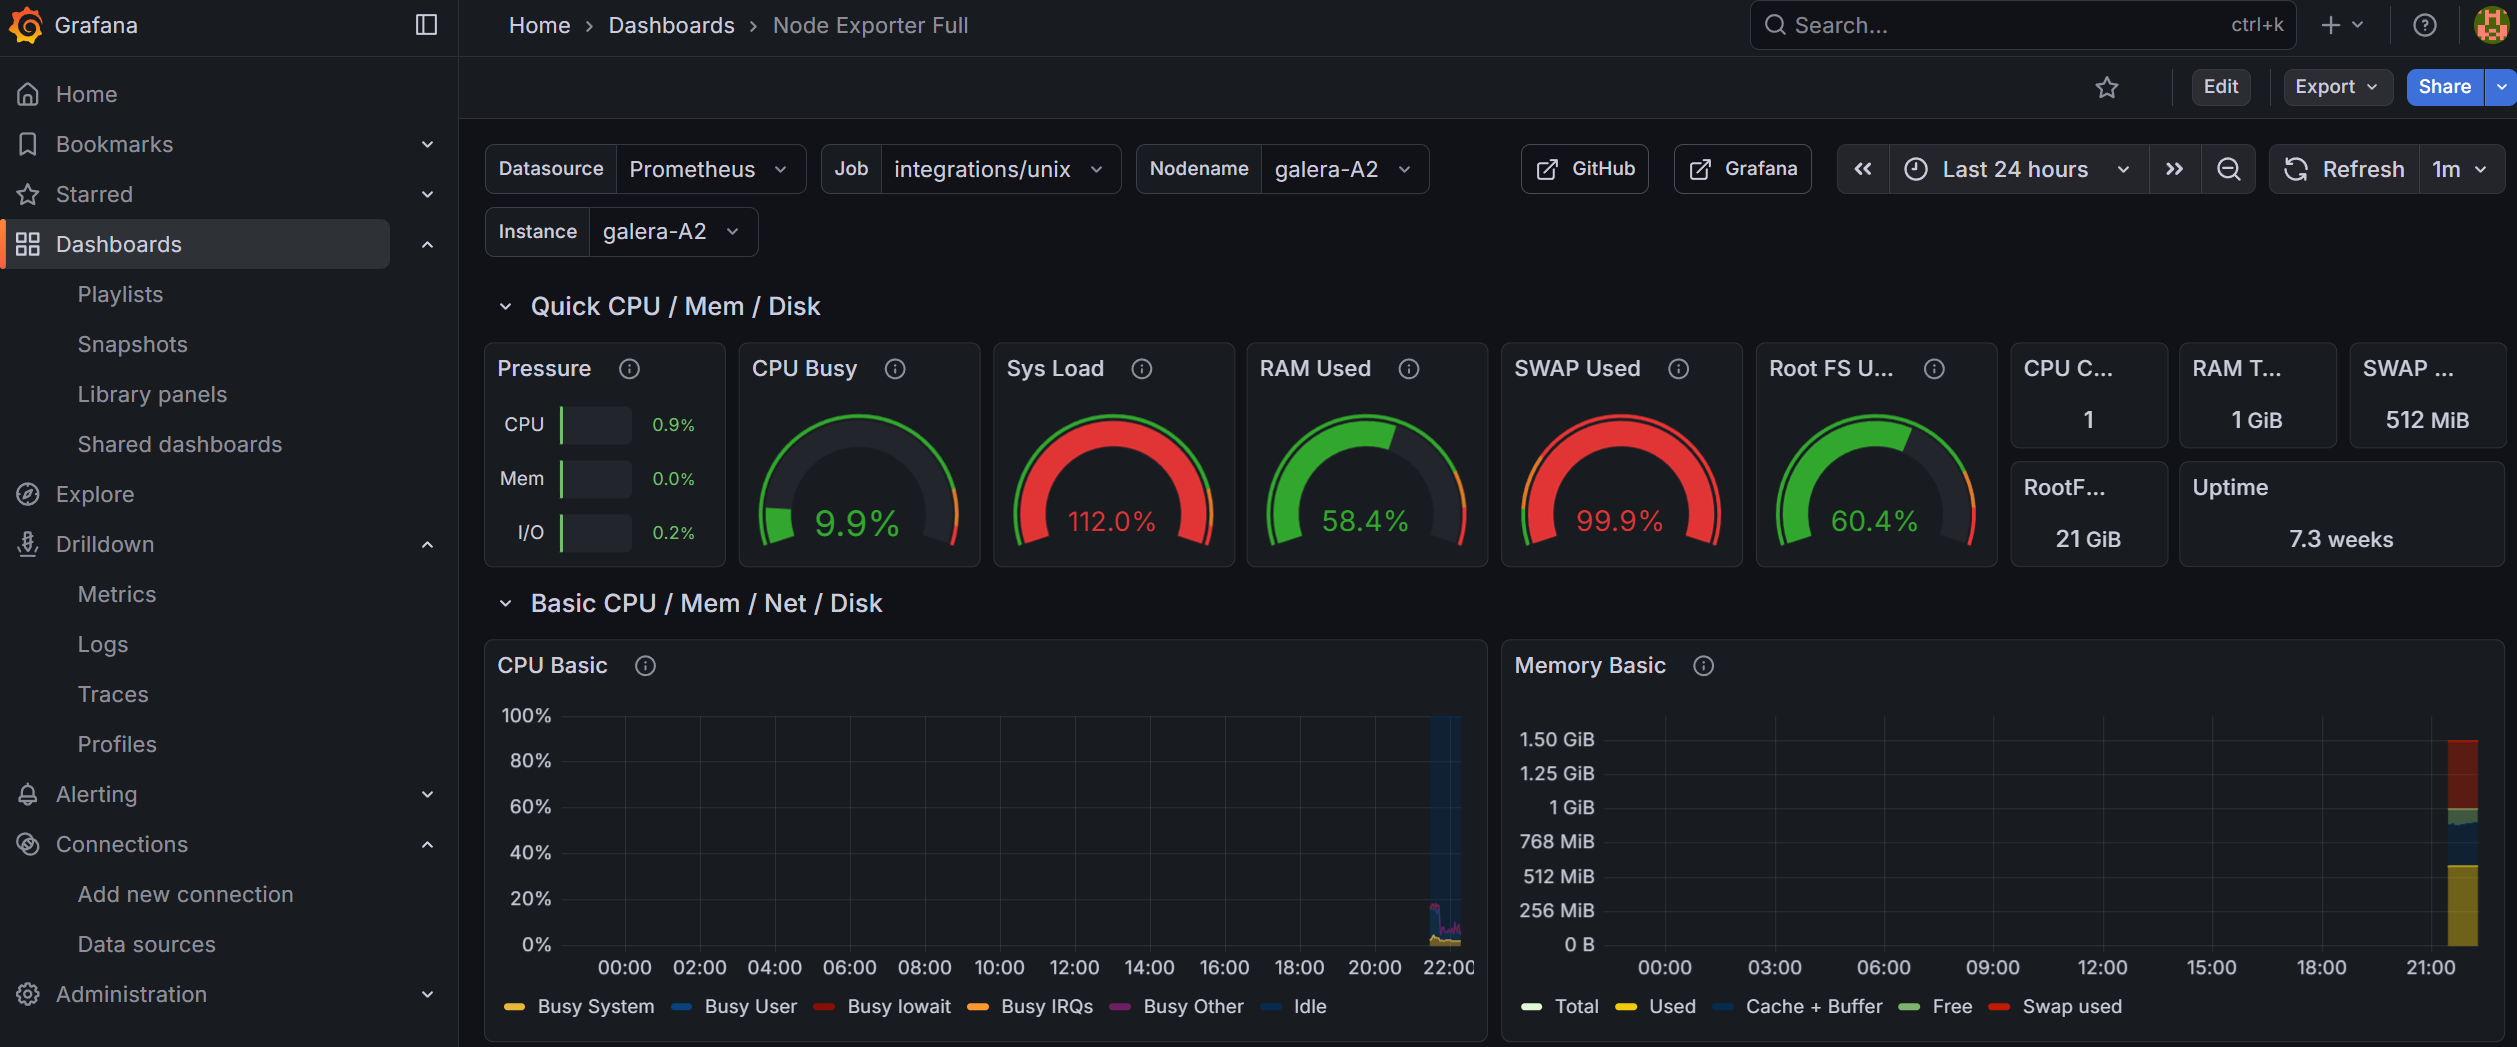
And what do I know? I can already see an issue with my galera-A2 node in terms of CPU and swap usage (I resolved that manually but boy, would it not be nice to have an automated solution? Hint hint for Part 2):
Add support for monitoring systemd
The Alloy configuration template already includes systemd service monitoring via the systemd collector. It tracks the status of key services defined in the unit_include regex filter (MariaDB, Nginx, Docker, SSH, etc.).
To verify it's working, go to Explore → Prometheus and run:
node_systemd_unit_state{instance="your_hostname", state="active"}You should see entries for each monitored service. The custom Infrastructure Overview dashboard (imported below) includes a "Services Status" panel that displays this data at a glance.
To add or remove monitored services, edit the unit_include regex in the config.alloy.j2 template and re-deploy via AWX.
Import a custom dashboard
There is a whole plethora of dashboards that you can import from the internet. What I was missing slightly was a one-view overview of RAM, disk and service uptime status.
One custom dashboard that might be of interest is something that I drafted with Claude's help (as it was getting quite complicated):
📎 infrastructure-overview-dashboard-RAM+CPU+disk+systemd.json
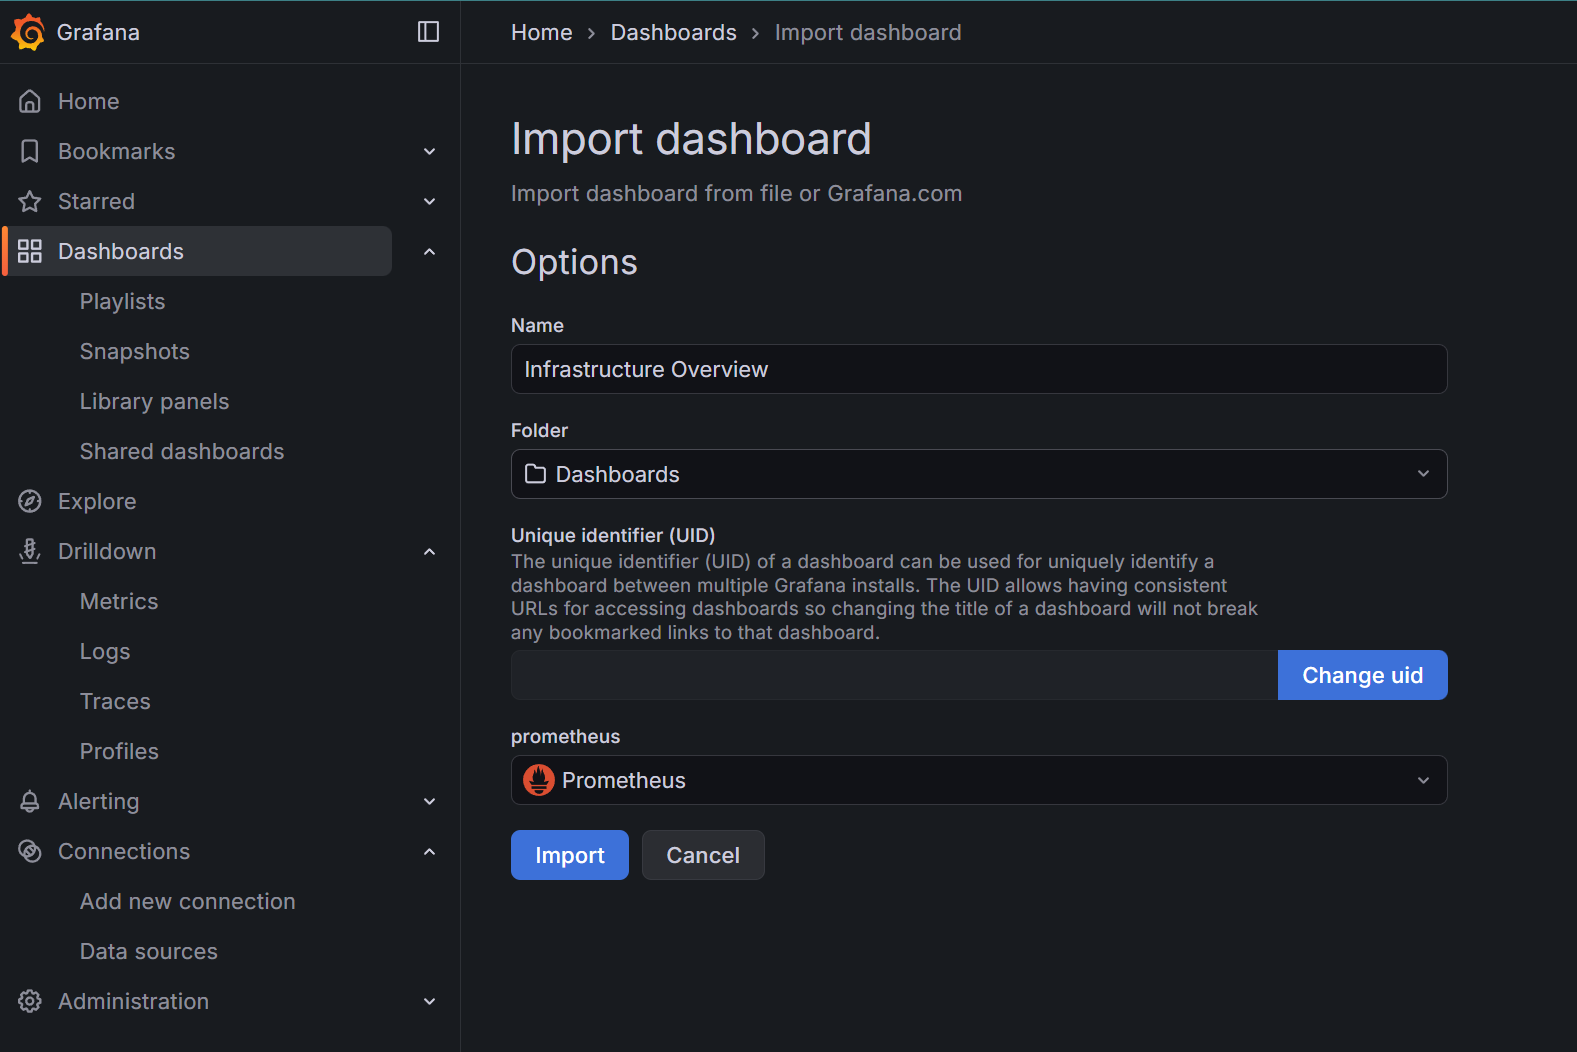
Here's what it looks like with RAM + disk + CPU + systemd (pre-defined services) monitoring:

I personally prefer this custom developed overview much more, as it gives me a one-glance overview of everything I care about, including IO pressure and failing systemd services.
And there you have it! Logs are sorted. This is a cornerstone for Part 2 of this tutorial to demonstrate how you can pair it up with automated workflows in a self-hosted version of n8n that can be connected to AI (such as Claude) to deliver and summarize advice related to the findings from your metrics.
What is more, we can then even allow some level of independence to AI to implement a few recommended fixes based on the level of risk. Are you ready?
Internal notes:
- To ensure that Corosync on proxmox3 does not get flagged, since it is inactive and unused:
# Double check it is not active:
sudo ls /etc/pve/corosync.conf

# If empty, continue further:
sudo systemctl unmask corosync
sudo mkdir -p /etc/systemd/system/corosync.service.d
sudo nano /etc/systemd/system/corosync.service.d/override.conf

# Copy paste this into it:
[Unit]
# This line clears the requirement for the config file to exist
ConditionPathExists=

[Service]
ExecStart=
ExecStart=/bin/true
RemainAfterExit=yes

# Save and exit, restart the services and check the status
sudo systemctl daemon-reload
sudo systemctl start corosync
sudo systemctl status corosync